|
||
|
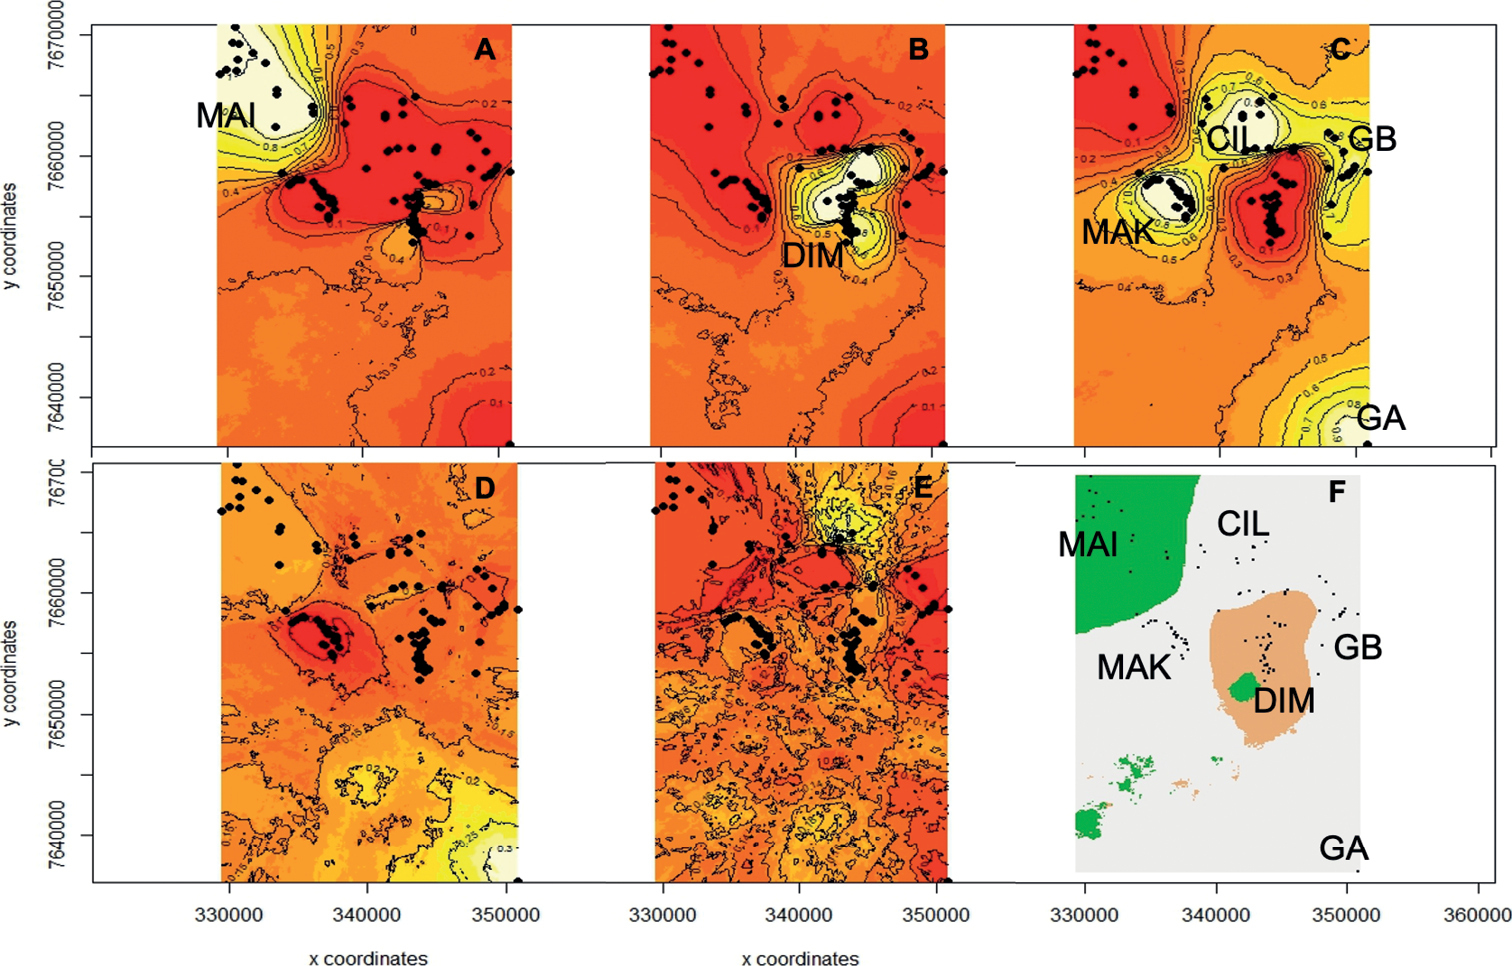
Spatial distribution of each group defined by Geneland for sampled feral cats (n = 158), on Réunion Island, 2015–2016. Black dots represent sample locations A, B, C, D and E are maps of posterior probability to belong to each group. Clusters are indicated by areas with different intensities of colour. Probability of population membership increases as shading intensity decreases (values of probability are indicated on each contour line) F shows the mode map of the posterior probability to belong to each group (see Table 1 for area codes). Unit of axis is metre. |