|
||
|
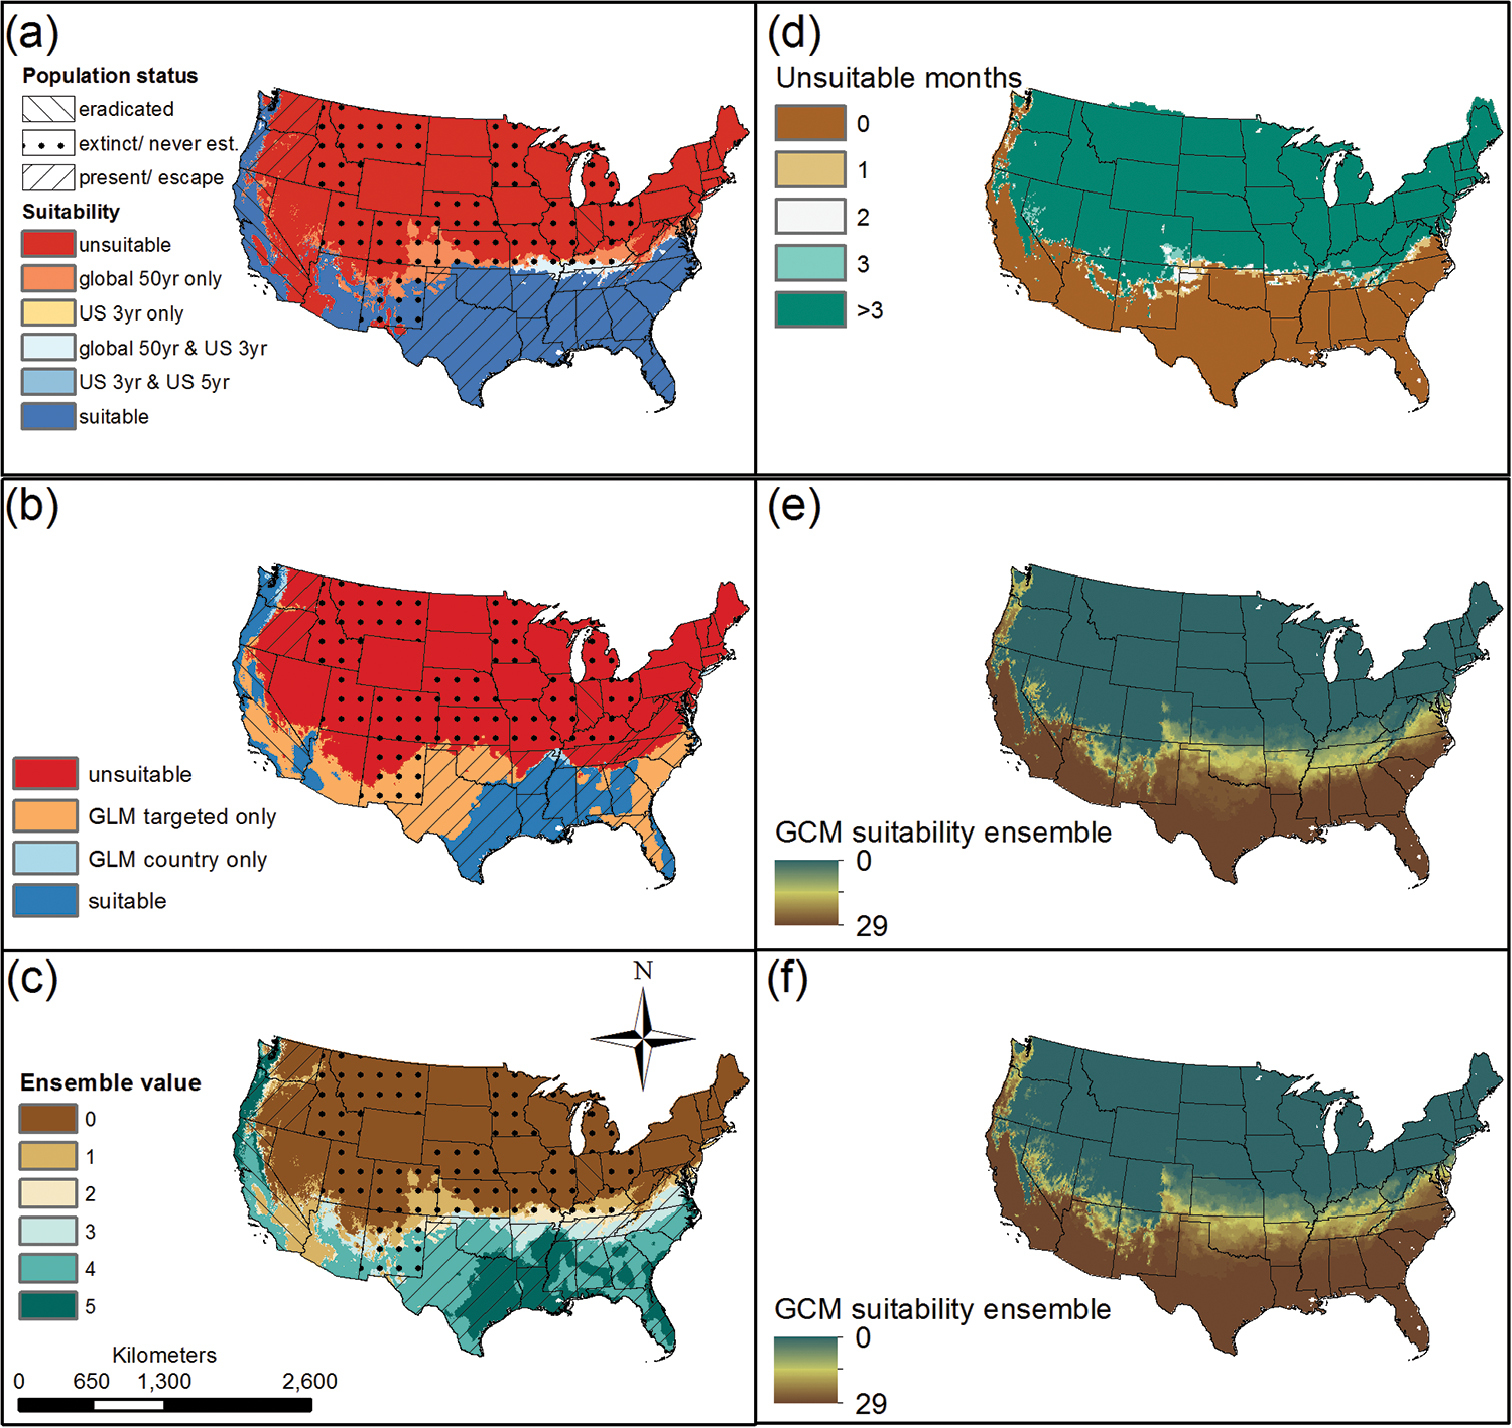
Model predictions for Myocastor coypus [Molina, 1782] for a an ensemble of US 3yr, US 5yr, and global 50yr b an ensemble of GLM country and GLM targeted c an ensemble of all five models d number of months classified as unsuitable using the Maurer observed climate data for 2001 to 2010 e the number of GCMs defining each pixel as suitable (ensemble of the 29 binary downscaled GCMs using the Maurer dataset as the reference) f ensemble of the 31 downscaled GCMs average from 2040 to 2050. All maps are overlaid with USA state population status according to Carter and Leonard (2002). Unsuitable habitat is defined as areas where no models predicted the area as suitable, while suitable areas are defined according to which model(s) predicted suitable habitat. Maps are in Albers Equal Area projection. |