|
||
|
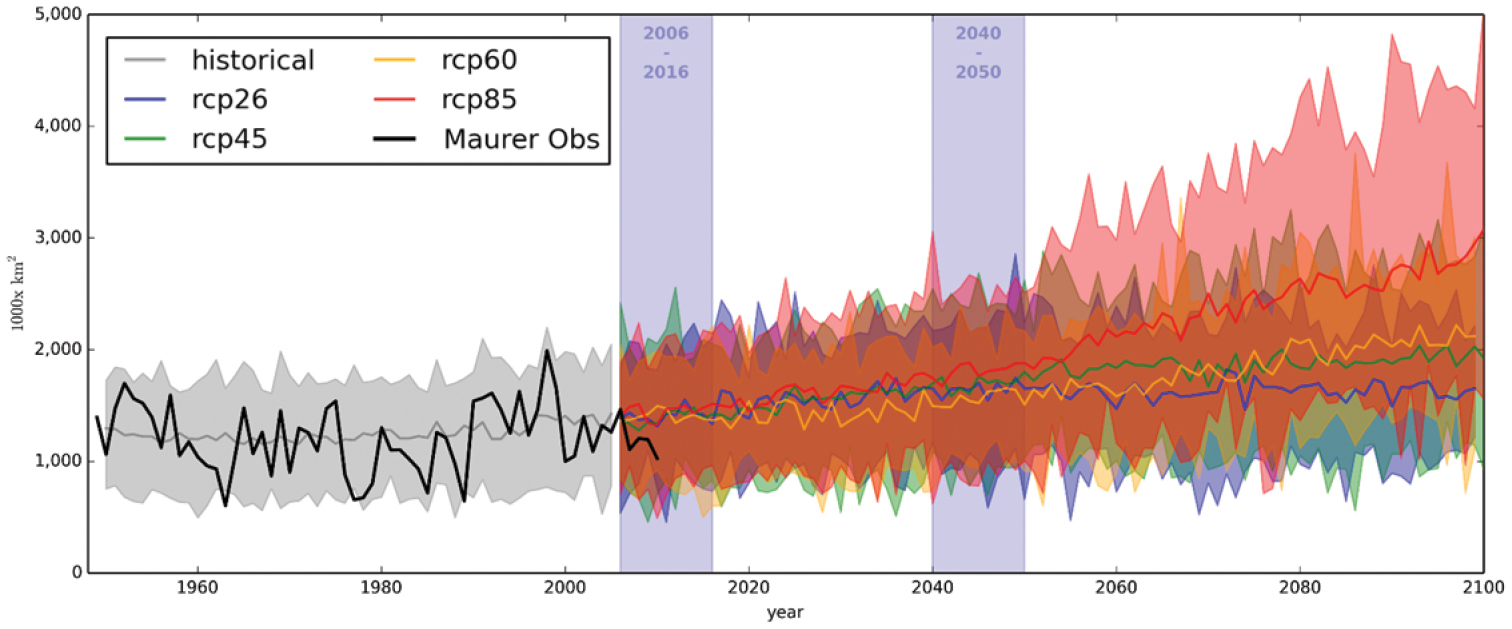
Amount of suitable habitat for coypu by year starting in 1950 and extending to 2100. Amount of suitable habitat is defined as thousands of km2 within the continental USA without any months where average minimum temperature was <0 °C while average maximum temperature was also <5 °C. The solid black line from 1950 to 2013 is the Maurer observed dataset, the historical data is the 12 General Circulation Models (GCMs) calibrated between 1950 and 2013 using the Maurer dataset, and the projected climate by the GCMs with the average amount of predicted suitable habitat (solid line) and variation in predicted suitable habitat (solid colored area) for the four different representative concentration pathways (RCPs) describing possible climate futures by the GCMs. The solid vertical bars indicate the time periods for which we created geographic maps of predicted suitable habitat. |