|
||
|
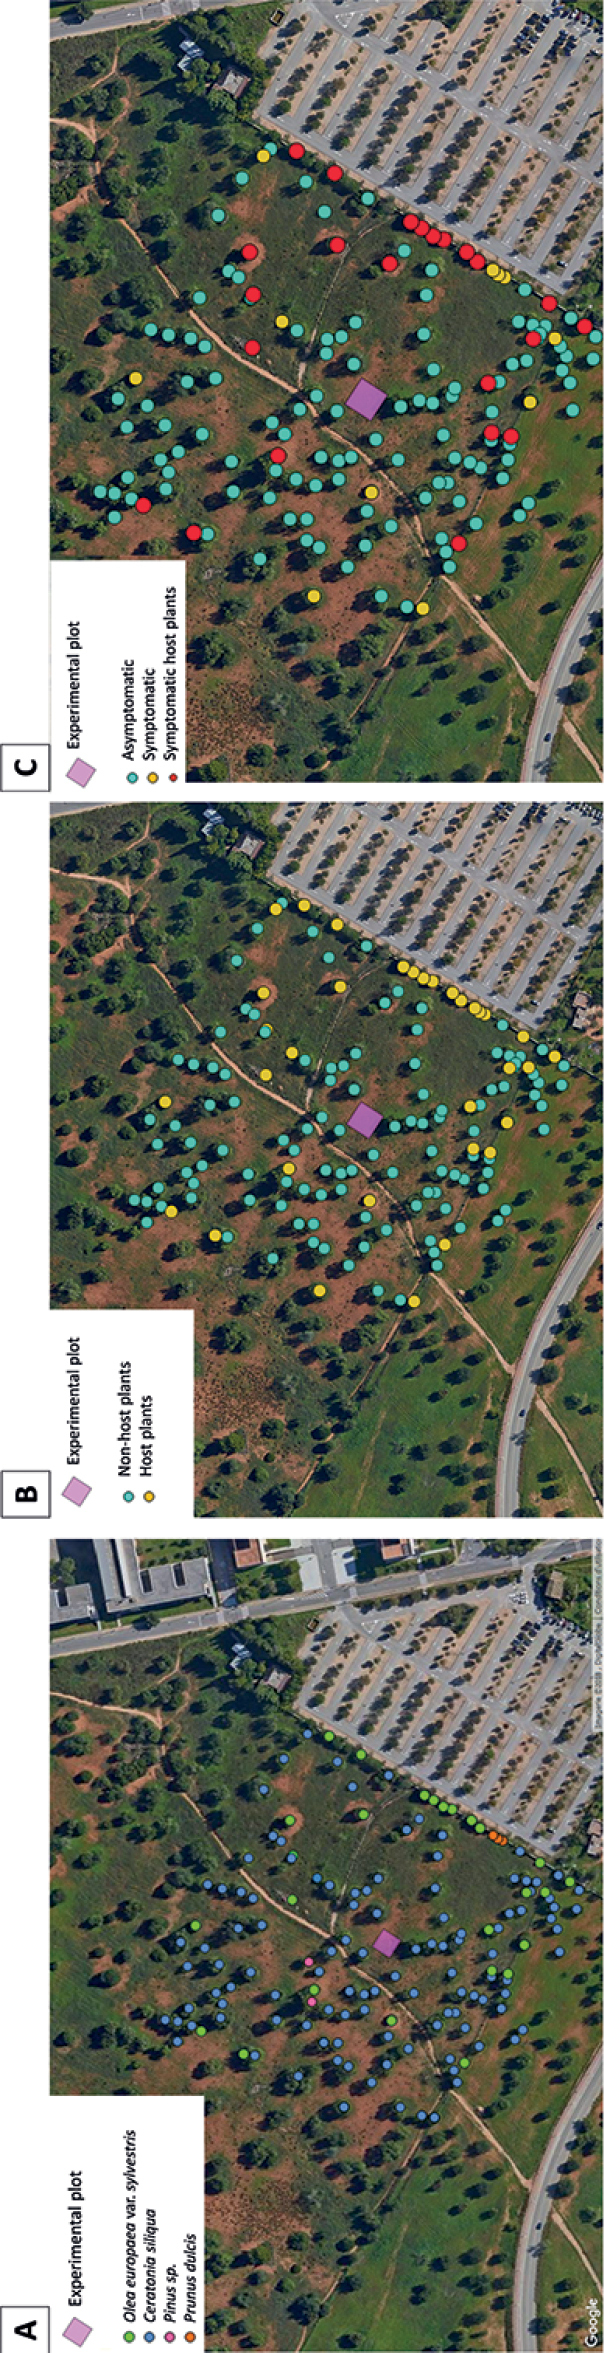
Tree species inventory, host and health status around the sentinel plantation A map of the different tree species in the area of 100 m around the plantation. The pink square is the experimental plot (the sentinel plantation). The green dots are for Olea europaea var. sylvestris (wild olive tree), the blue dots for Ceratonia siliqua (carob tree), the pink dots for the Pinus sp. (pine tree) and the orange dots for the Prunus dulcis (almond tree) B map of the host status of the trees located in the area of 100 m around the plantation. The green dots are the non-host plants of X. fastidiosa and the yellow dots are the host plants of the bacterium C map of the symptomatic trees located in the area of 100 m around the plantation, presenting typical X. fastidiosa leaf scorches. The green dots are the asymptomatic plants, the yellow dots the symptomatic plants and the red dots the symptomatic plants that are host plants of the bacterium. The maps were created with the QGIS software with maps from Google Earth, Imagery 2018, DigitalGlobe. |