|
||
|
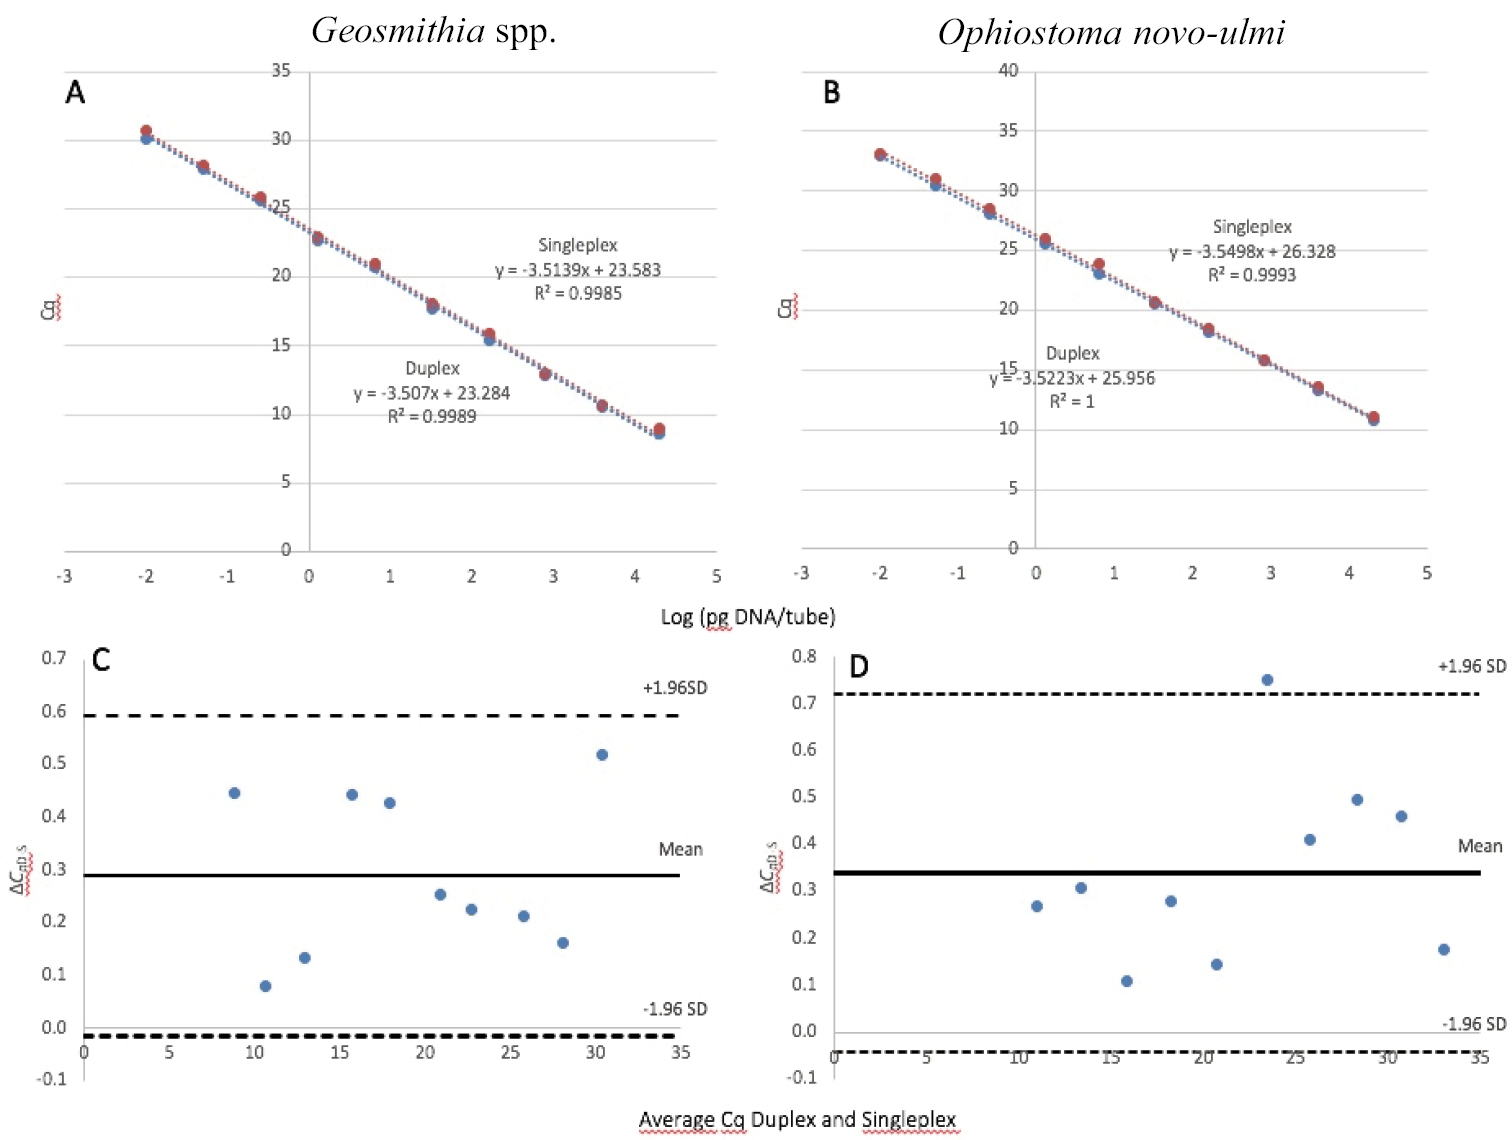
Comparison between singleplex and duplex qPCR A standard curve of Geosmithia spp. and B Ophiostoma novo-ulmi generated with the singleplex (blue dots) and duplex (red dots). For each targeted gene, ten different 1:5 serial dilutions (ranging from 5 ng μl–1 to 2 fg μl–1) of Geosmithia spp. and O. novo-ulmi standard DNA were assayed in triplicate. Standard curves were generated by plotting the threshold quantification cycle value (Cq value) versus the logarithmic genomic DNA concentration of each dilution series. The Bland-Altman plot for Geosmithia spp. (C) and O. novo-ulmi (D) are shown for the same serial dilutions. The Cq difference between the two methods (ΔCqD-S) is plotted against the average of both methods (x-axis) for every individual pair of measurements. The interval of the mean of the difference ± 1.96 times the standard deviation (SD) defines the 95% interval of the limits of agreement. |