|
||
|
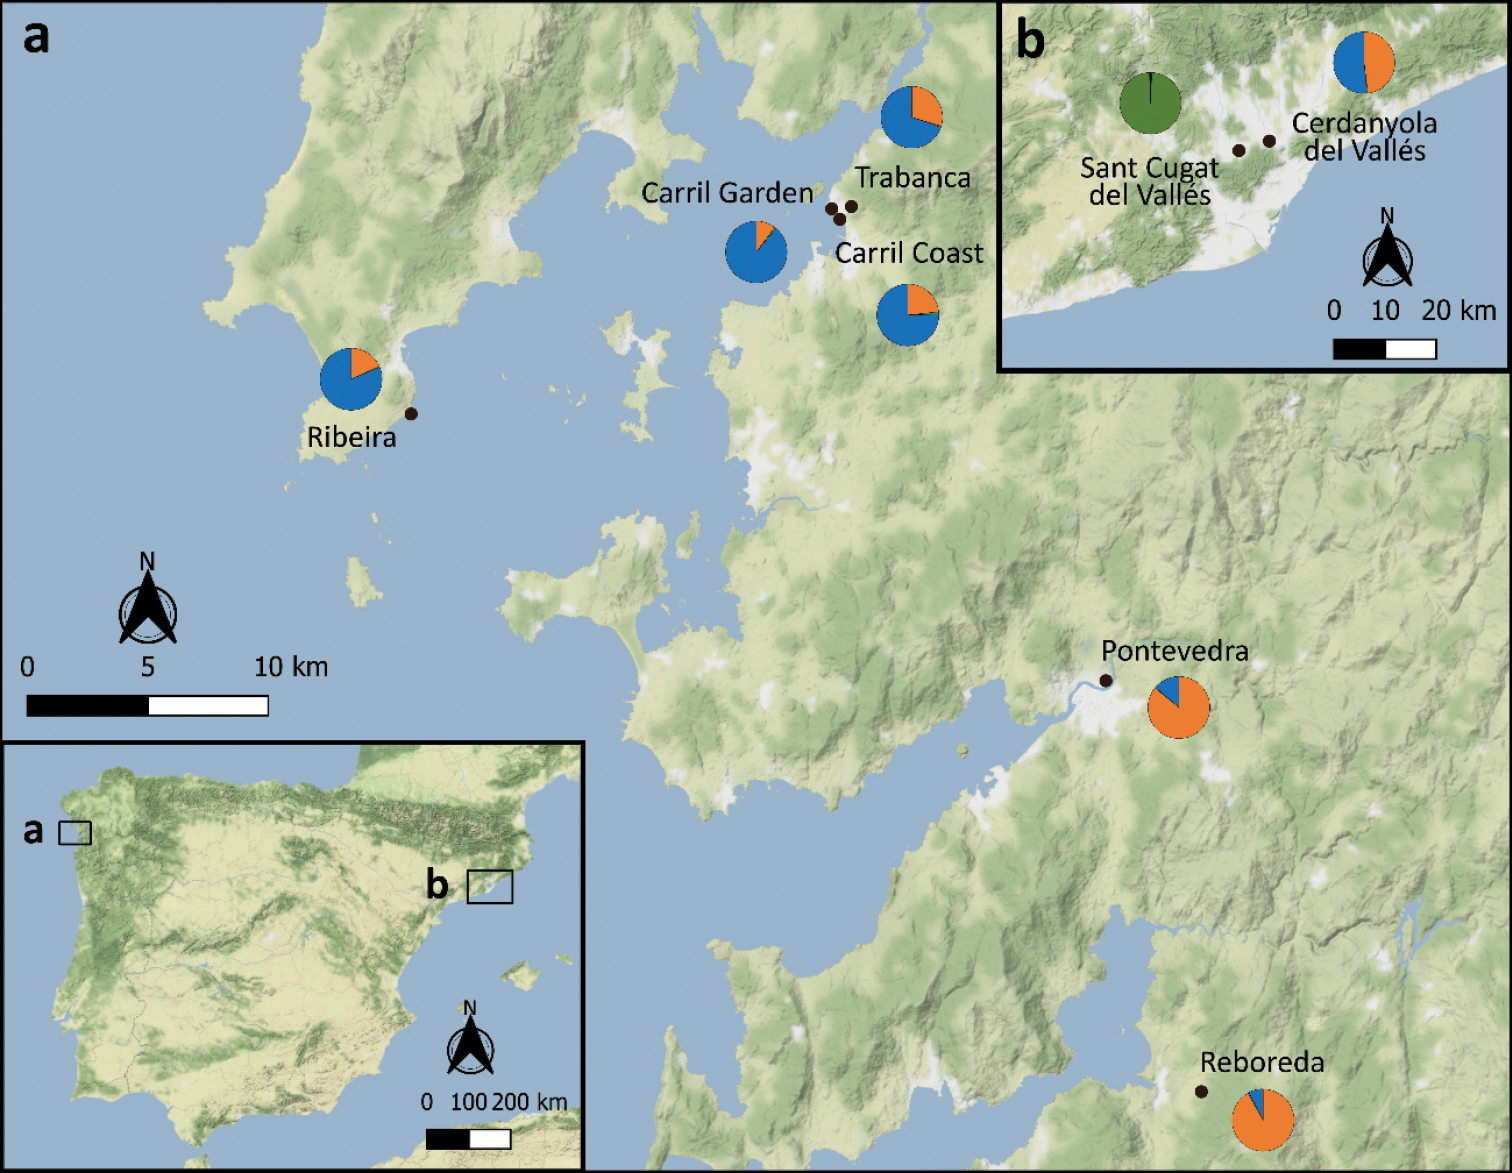
Map showing the location (black dots) of the eight colonies of Linepithema humile sampled for this study and listed in Table 1. Pie charts by each locality illustrate the proportion of individuals from each locality that were assigned to each of the genetic clusters identified by Structure (see Results and Fig. 7 and Suppl. material 1: Fig. S3). The figure has been created using QGIS version 3.22.3 (Anon 2022). |