|
||
|
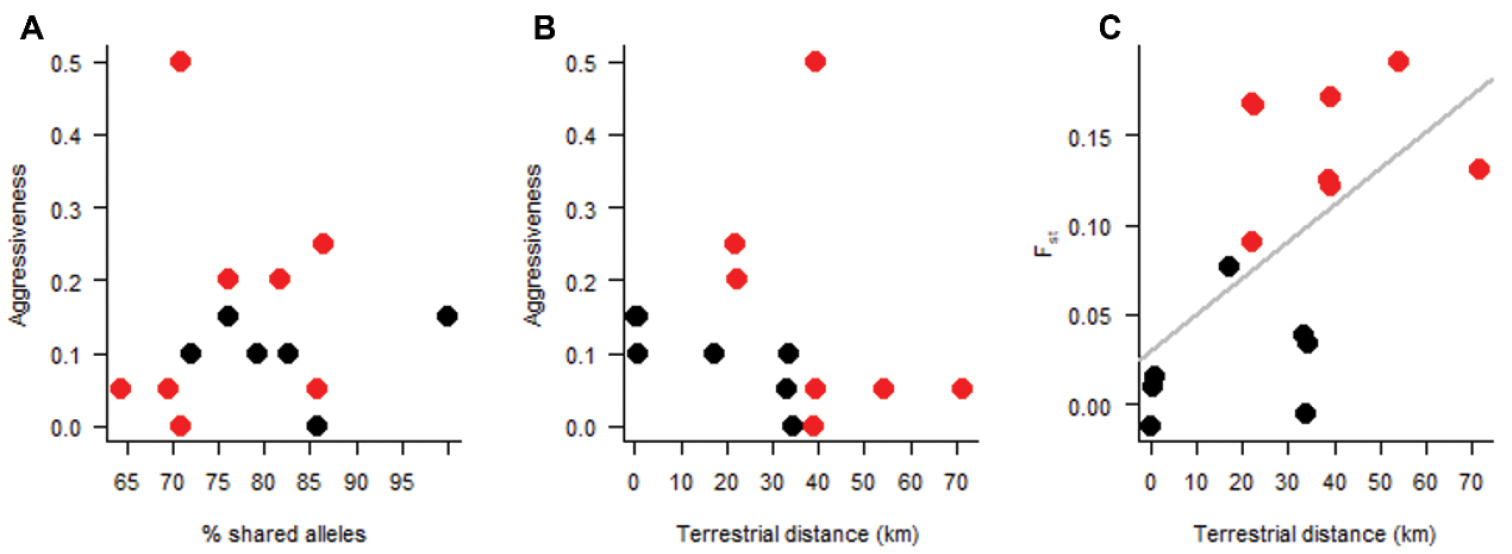
Relationships A between the percentage of shared alleles and the aggressiveness B between terrestrial distance and aggressiveness; and C between terrestrial distance and FST. Regression line is drawn for significant relationship (r = 0.57). Black dots represent pairs of colonies from the same genetic cluster, while red dots represent pairs of colonies from different genetic clusters. Note that these graphs include only populations sampled in Galiza. |