|
||
|
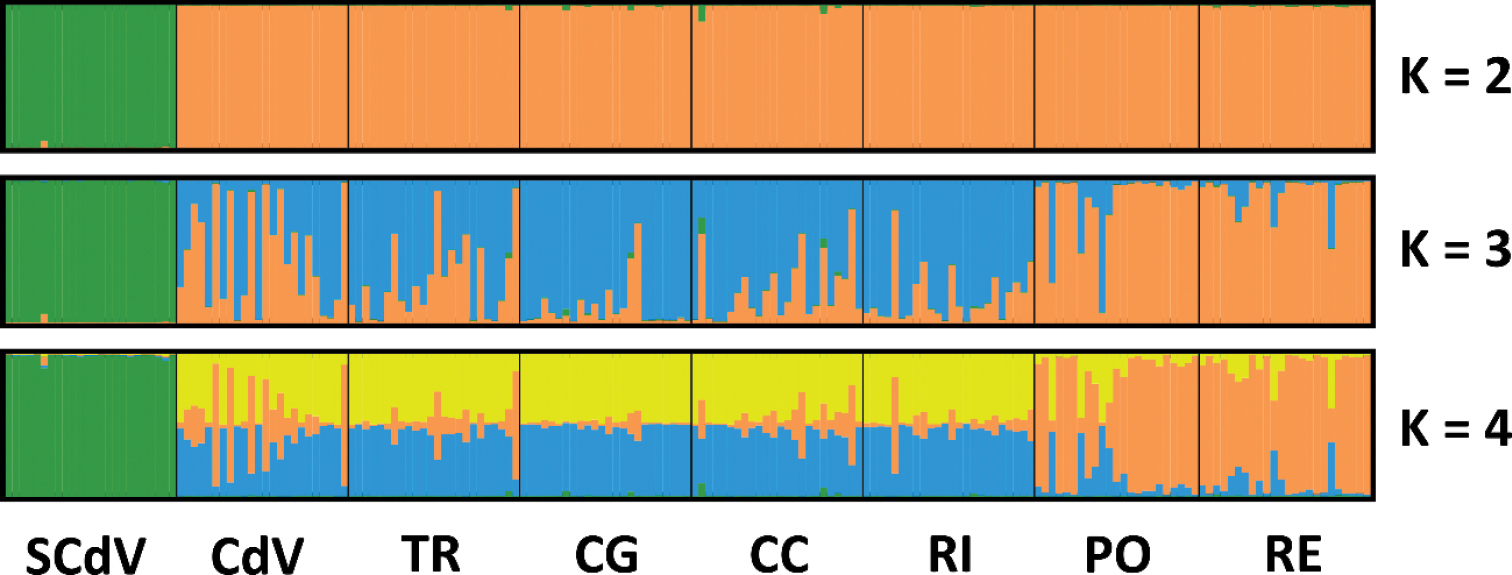
Genetic clustering of the eight Linepithema humile populations genotyped in this study, based on the seven microsatellite loci from Suppl. material 1: Table S1. Sampled localities are separated by black lines and each individual within the sampled localities is represented by a vertical bar. The proportion of colours in each bar indicates the genomic proportion derived from each genetic cluster. The plots presented here show that results of the Structure analysis with K = 2, K = 3 and K = 4. Populations from Galiza are listed according to the N-S geographical sampling gradient (see Fig. 1 and Table 1). Sant Cugat del Vallés: SCdV; Cerdanyola del Vallés: CdV; Trabanca: TR; Carril Garden: CG; Carril Coast: CC; Ribeira: RI; Pontevedra: PO; Reboreda: RE. |