|
||
|
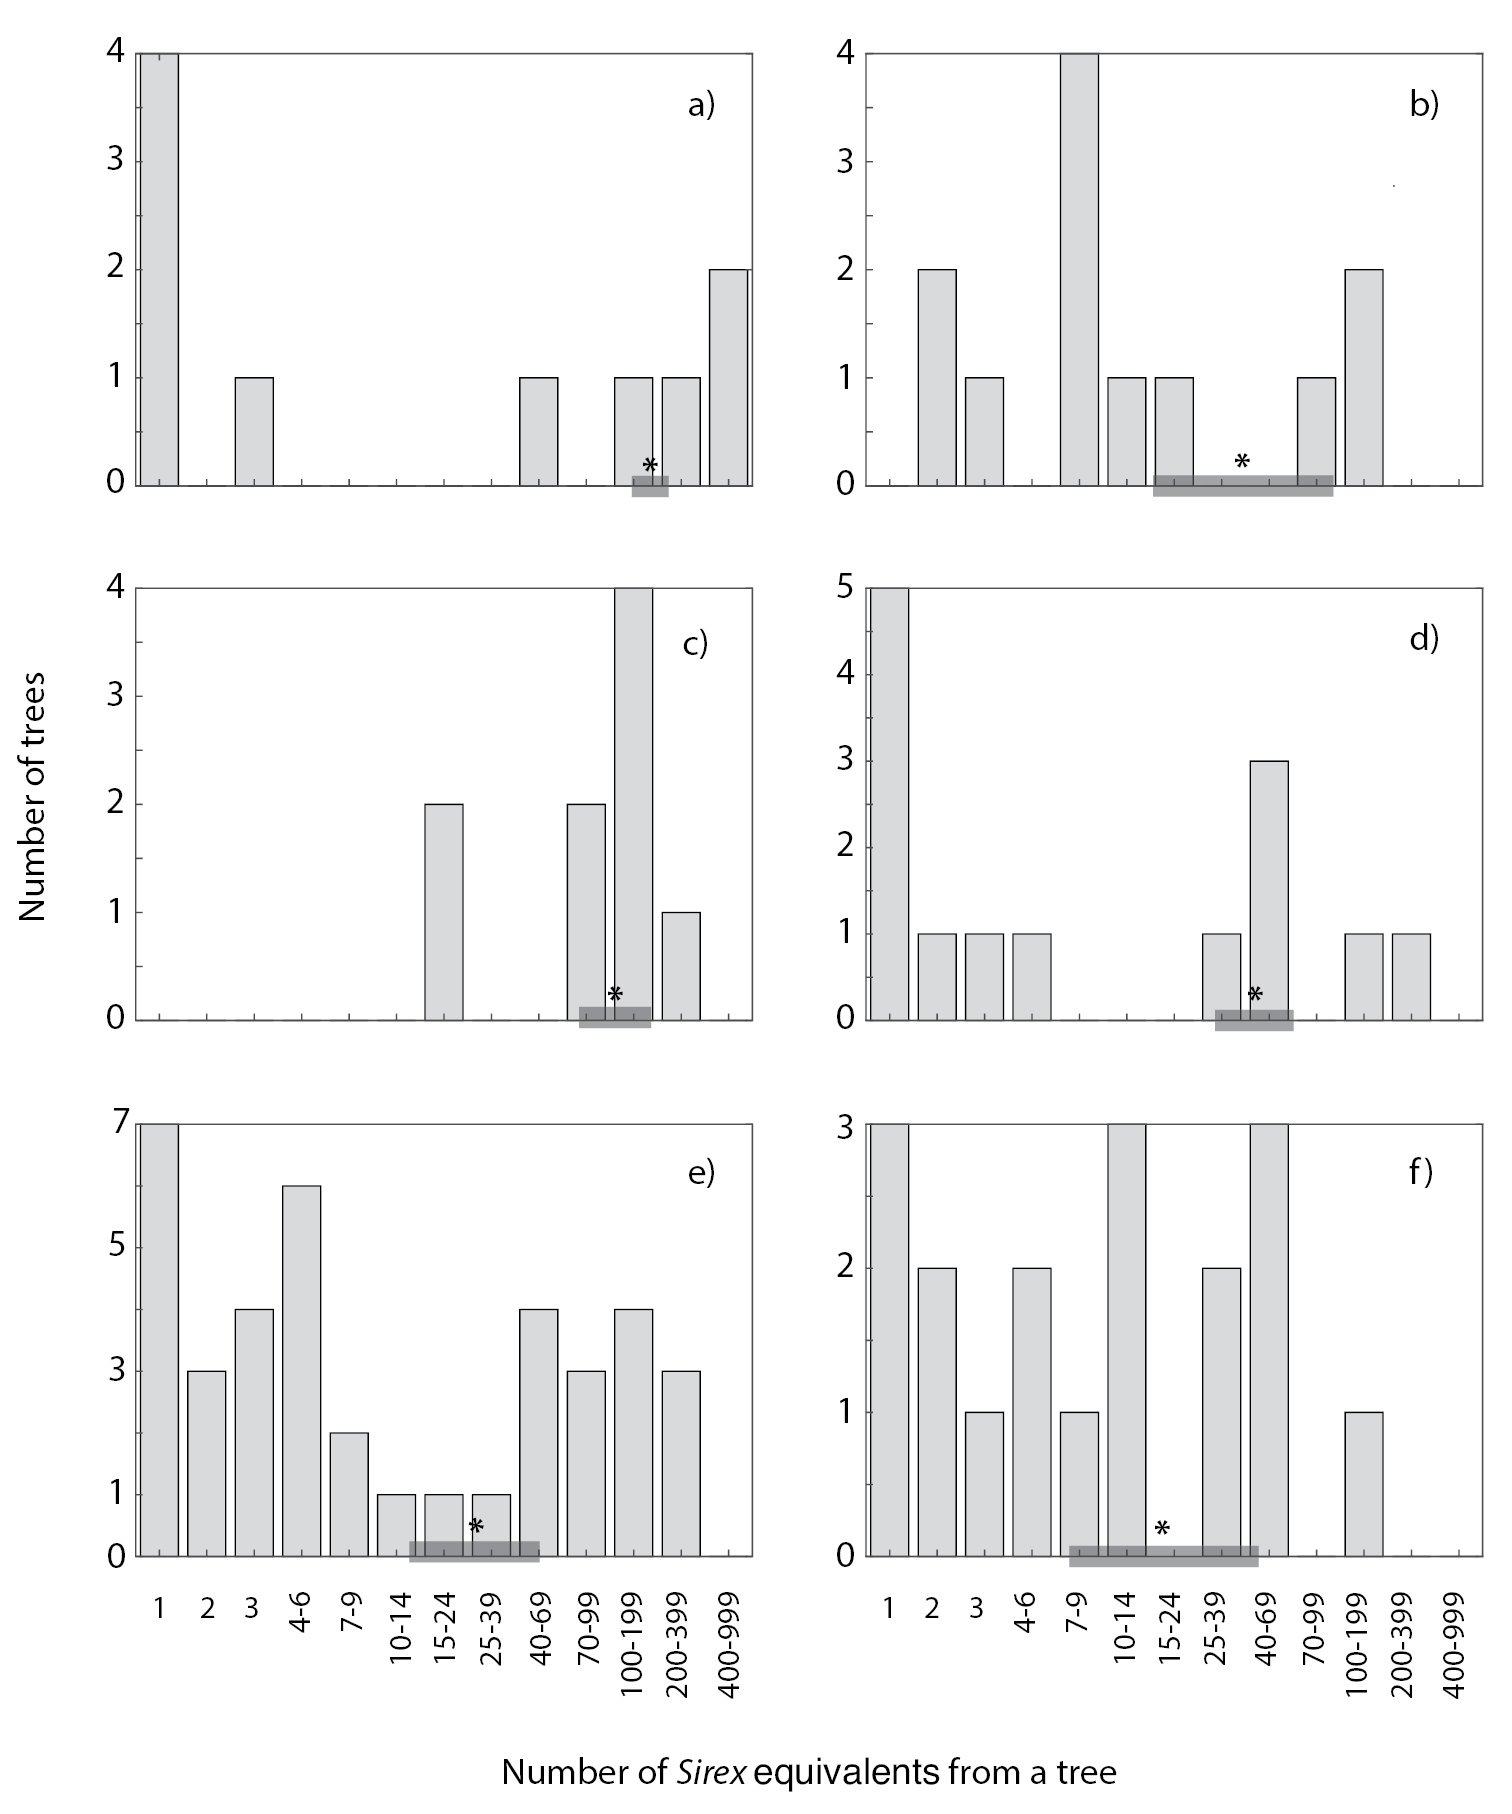
The distribution of Sirex equivalents (Sirex adults + parasitoid adults) emerging from the 6 sites with the most data (each had 398 or more Sirex equivalents and nine or more trees). The wasps were strongly aggregated in these and the other 6 sites tested (see text). * denotes the mean number of Sirex equivalents per tree. The horizontal gray bars represent the 95% CI range of wasps per tree if the Sirex were distributed randomly among the trees, which would be a Poisson distribution (as shown in the inset in Fig. 1). The number of wasps along the x-axis is shown in a modified log scale to make both small and large numbers of wasps visible. a) 2017 Hillsdale site, 2052 Sirex equivalents from 10 trees, b) 2013 Hypocrite Trail site, 400 Sirex equivalents from 12 trees, c) 2011 Government Rd. site, 1058 Sirex equivalents from 9 trees, D) 2012 Government Rd. site, 575 Sirex equivalents from 14 trees, e) 2014 Hypocrite Trail site, 2055 Sirex equivalents from 39 trees, f) 2012 Hypocrite Trail site, 398 Sirex equivalents from 18 trees. |