|
||
|
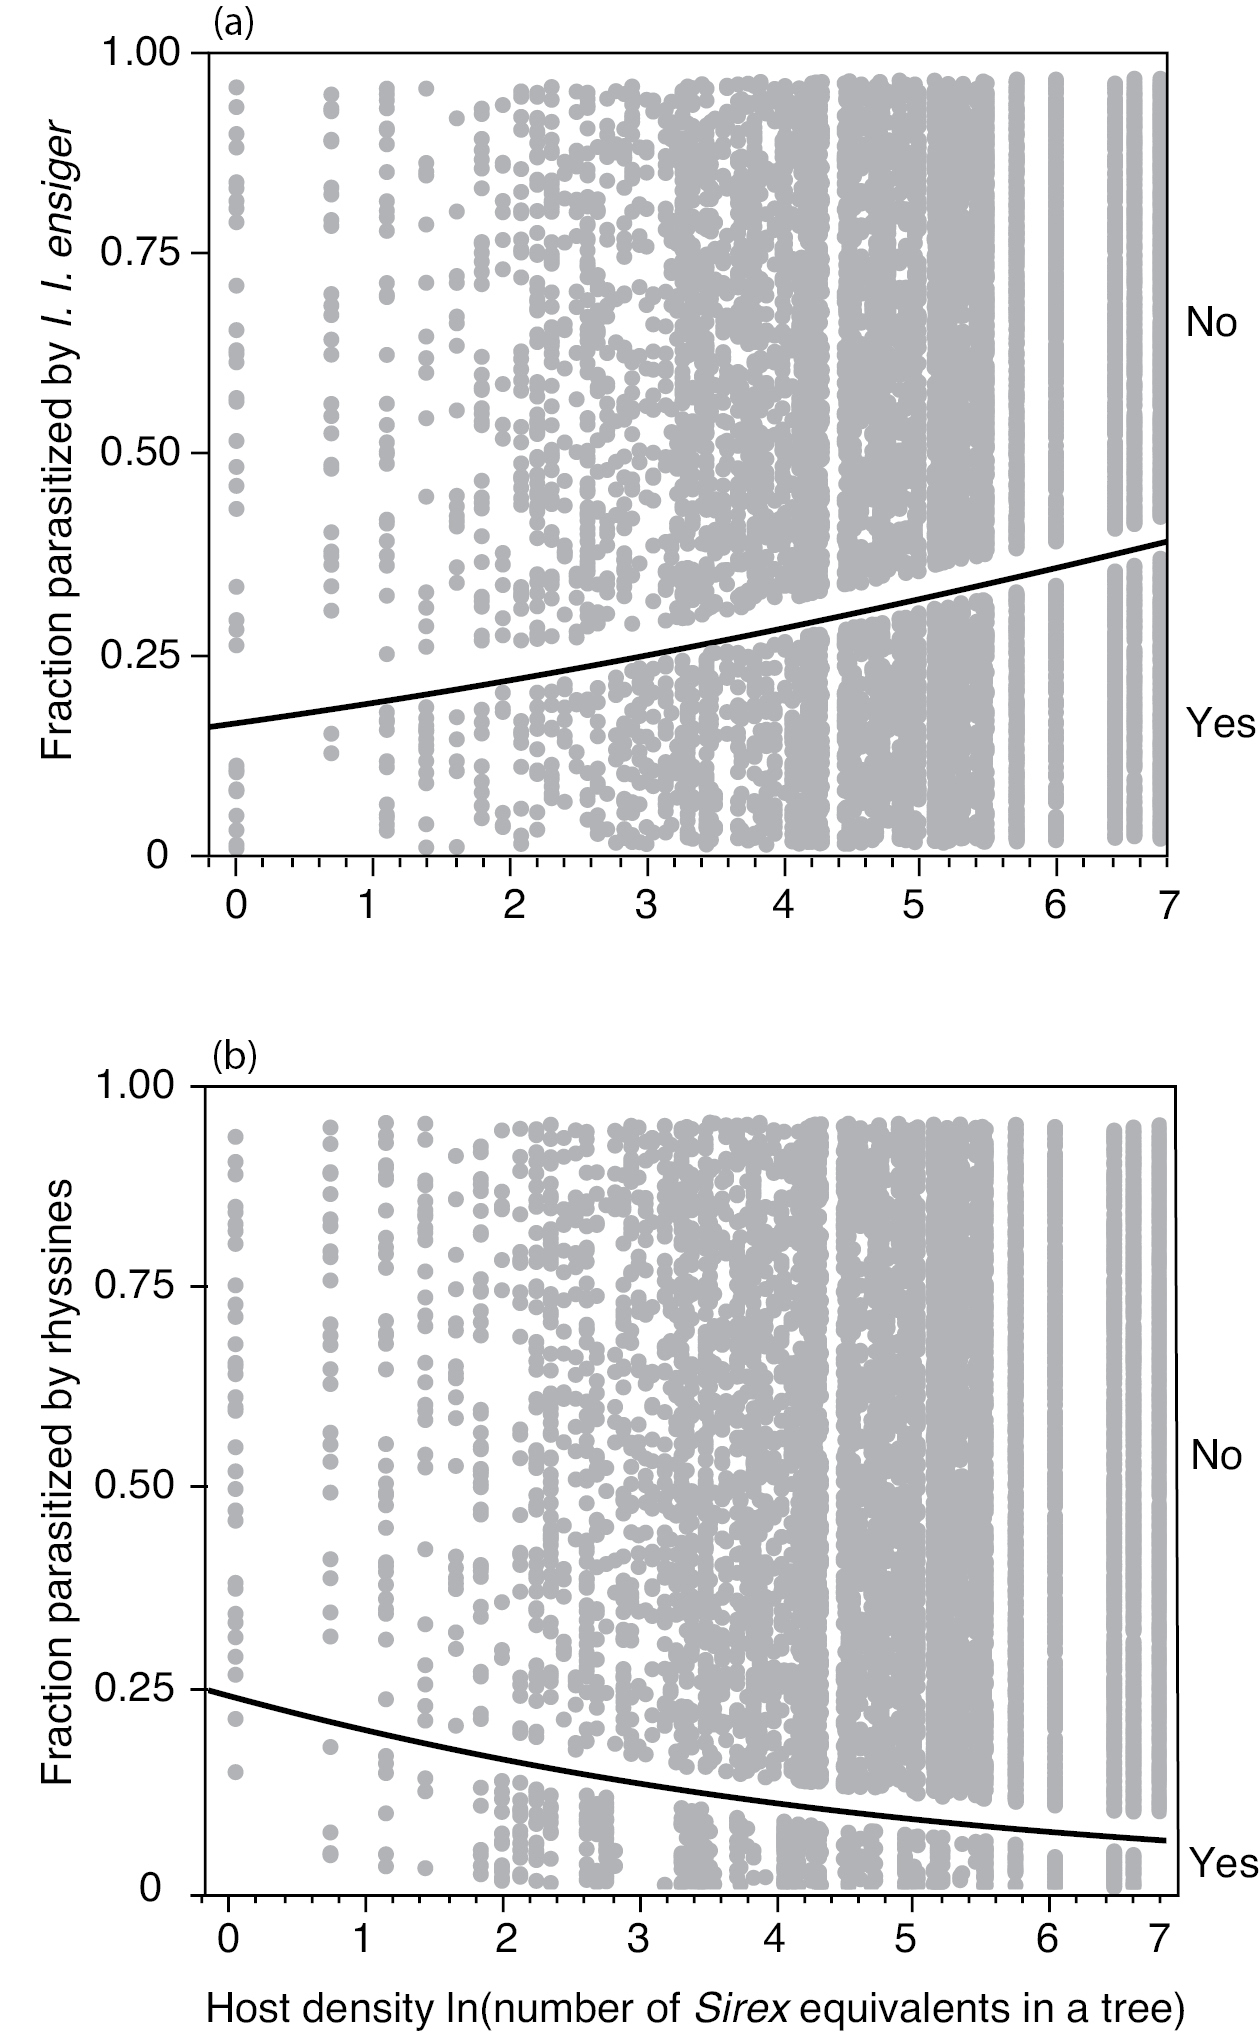
The association of parasitism by parasitoids with tree level host density. The curves show the logistic fit for a I. l. ensiger (P < 0.0001; Table 3c) and b rhyssines (P = 0.0004; Table 3d). The horizontal axis shows host density as the log of the number of Sirex equivalents (adult Sirex + all parasitoids) emerging from a tree. Each data point is one sample. The points are distributed vertically in order to show the amount of data at each host density. The points below the curve are parasitoids (Yes) a I. l. ensiger and b rhyssines, and the points above the curve are unparasitized Sirex (No). See text for explanation of the statistical models. |