|
||
|
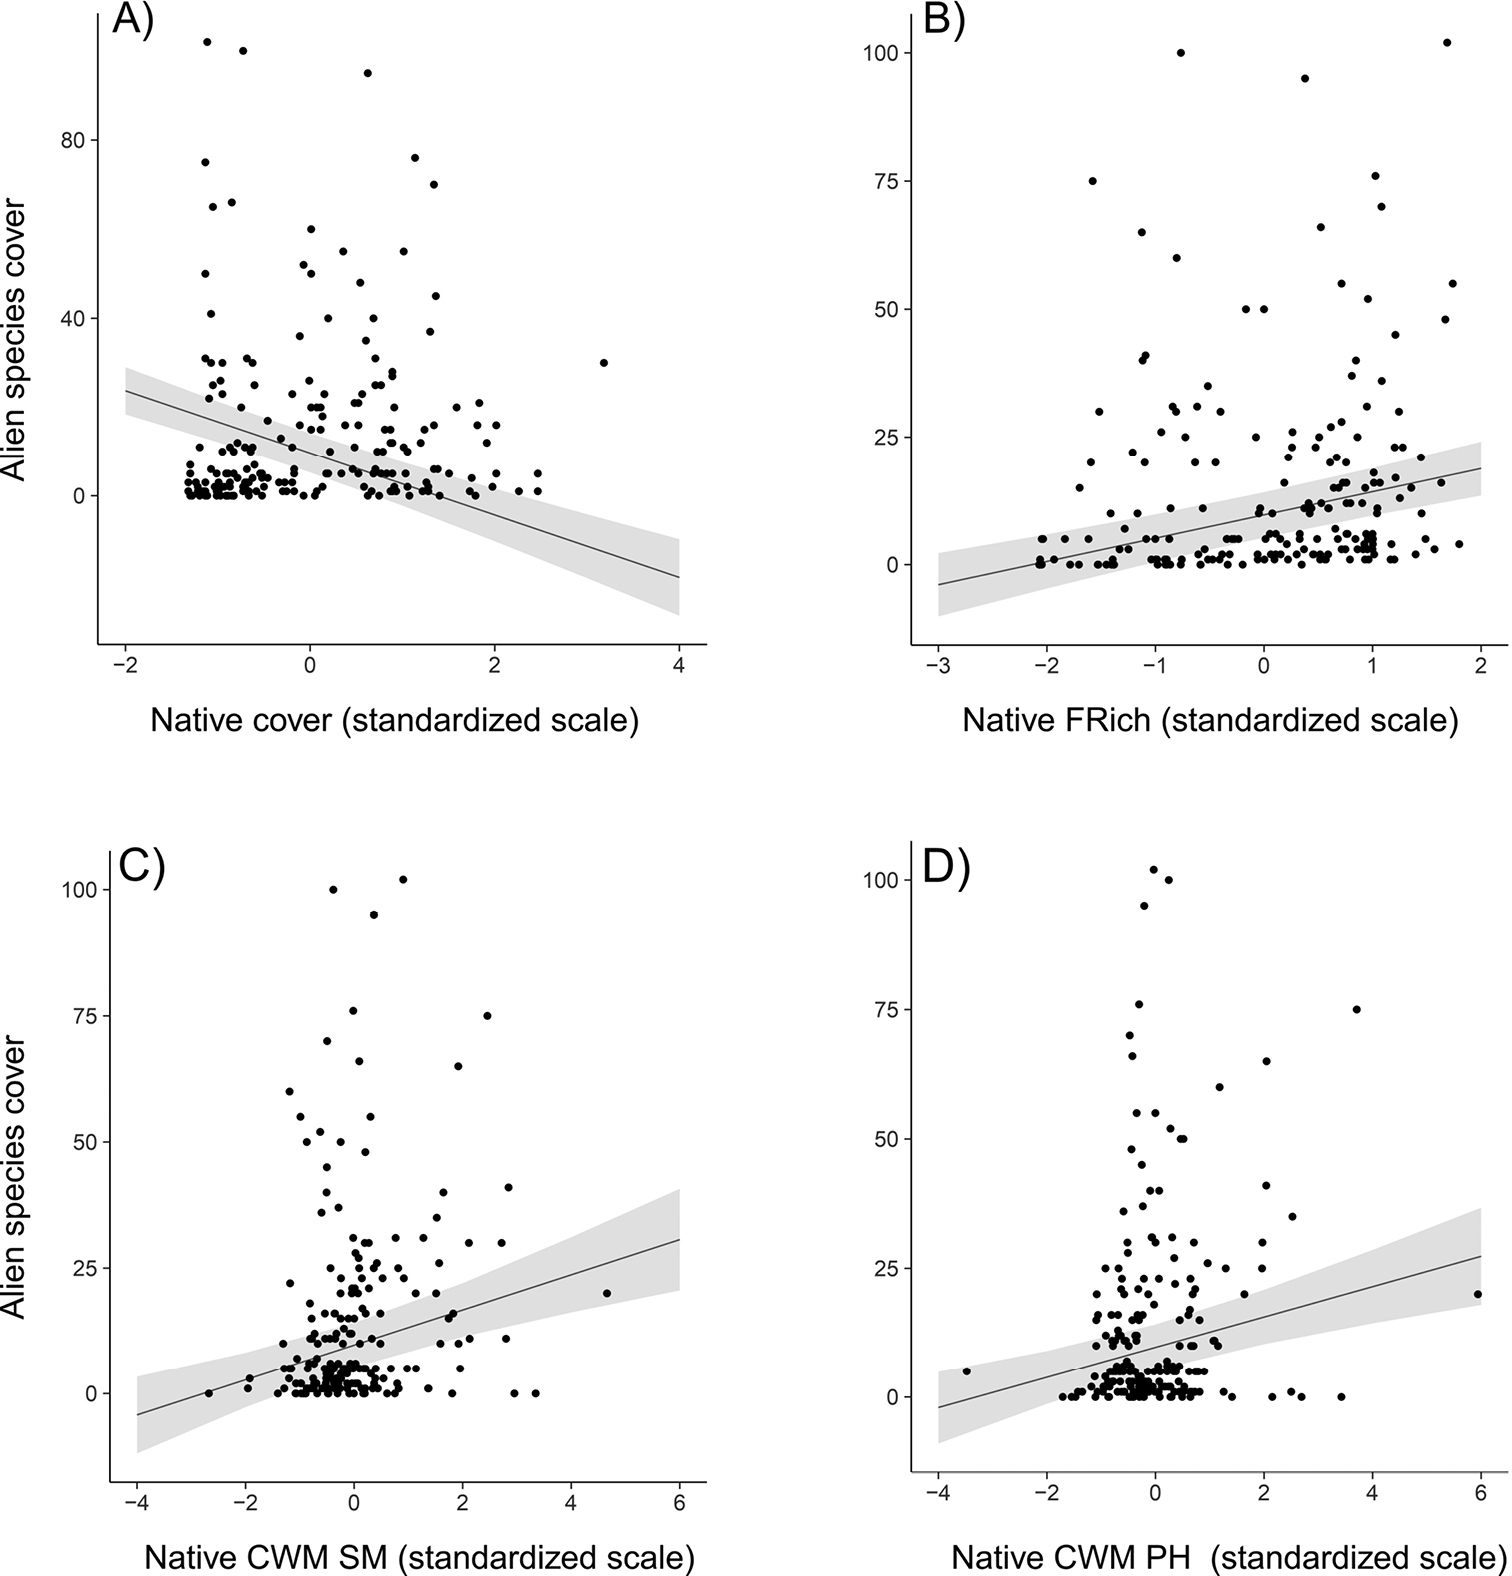
Alien species cover, estimated using LMM assuming a Gaussian distribution of the response variable (Table 3) as a function of A native cover B native functional richness (Native FRich) C native community weighted means seed mass (Native CWM SM) D native community weighted means plant height (Native CWM PH). Dots represent measured values, lines – marginal prediction and grey area – 95% confidence interval of prediction. |