|
||
|
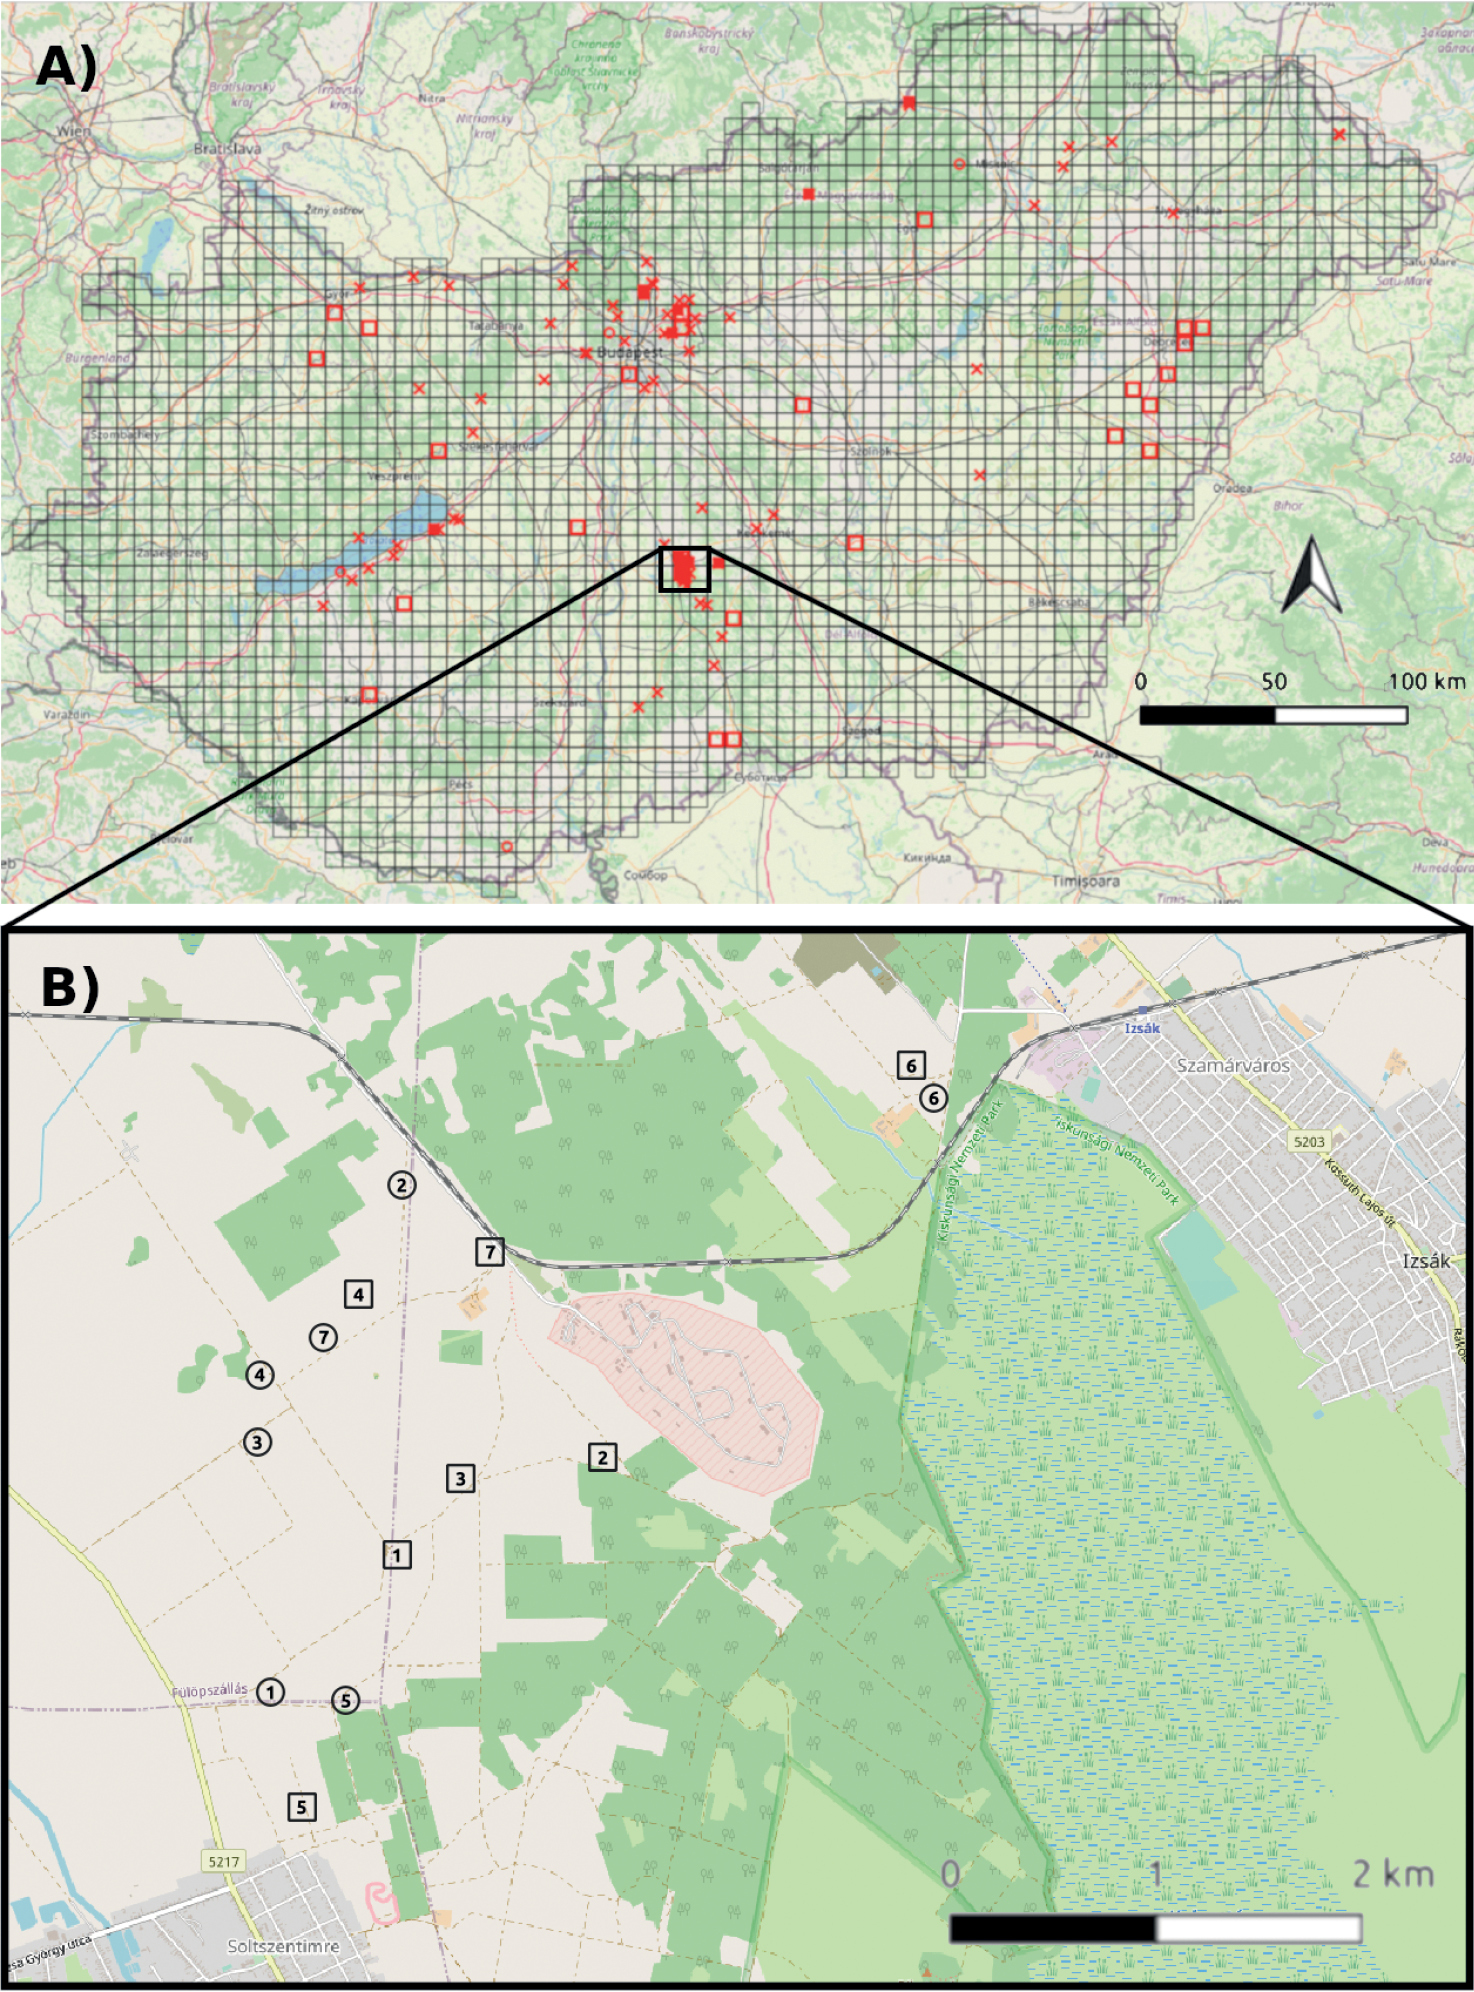
The occurrence of Gaillardia aristata within Hungary (A) and the sampling sites (B) A red squares represent the occurrences from the “Distribution atlas of vascular plants of Hungary” database (Bartha et al. 2022) in approx. 35 km2 grid of “Mapping of the Central European Flora” (shown by black thin grid). Red circles represent historical data from literature. Red crosses represent casual escape, while red filled squares represent naturalised or invaded populations, based on data from online databases, own observations and personal communications by experts. We do not present three points where the species has disappeared (see details in Suppl. material 1) B squares represent the sampled invaded, while circles represent control sites for invasion ecology study of G. aristata. Numbers represent site pairs. Map data 2022 OpenStreetMap. |