


(C) 2011 Daniela Wittenborn. This is an open access article distributed under the terms of the Creative Commons Attribution License, which permits unrestricted use, distribution, and reproduction in any medium, provided the original author and source are credited.
For reference, use of the paginated PDF or printed version of this article is recommended.
The worldwide transport of species beyond their native range is an increasing problem, e.g. for global biodiversity. Many introduced species are able to establish in new environments and some even become invasive. However, we do not know which traits enable them to survive and reproduce in new environments. This study aims to identify the characteristics of exotic ants, and to quantitatively test previously postulated but insufficiently tested assumptions. We collected data on nine traits of 93 exotic ant species (42 of them being invasive) and 323 native ant species in North America. The dataset includes 2536 entries from over 300 different sources; data on worker head width were mostly measured ourselves. We analyzed the data with three complementary analyses: univariate and multivariate analyses of the raw data, and multivariate analyses of phylogenetically independent contrasts. These analyses revealed significant differences between the traits of native and exotic ant species. In the multivariate analyses, only one trait was consistently included in the best models, estimated with AICc values: colony size. Thus, of the nine investigated traits, the most important characteristic of exotic ants as compared to native ants appears to be their large colony size. Other traits are also important, however, indicating that native and exotic ants differ by a suite of traits.
alien species, Formicidae, Hymenoptera, insects, invasions, invasives, North America, tramp ants
Due to globalization, more and more species are being transported across the globe and introduced to regions where they did not occur before. Such species have taken step 1 of the invasion process (
A central question of invasion biology has been which species with which characteristics are the ones that establish themselves and become invasive. What separates such species from those that have not established populations in exotic ranges? Most studies focusing on this question investigated plants and vertebrates (reviewed in
Most countries and regions of the world are now populated by numerous exotic ant species. Hawaii, for instance, has no native ants but 51 exotic established ant species (
Despite this lack of formal quantitative analyses, exotic established and invasive ants are often assumed to have the following characteristics (
Using a dataset with more than 400 species, we quantitatively tested the six assumptions about the characteristics of exotic ants by comparing traits of exotic and native ant species in North America. These comparisons were done twice: once between exotic established ants and native ants, and once between exotic invasive ants and native ants. We expected that differences will be more pronounced for the latter comparison, as exotic invasive ants are the subset of exotic established ants that have successfully completed the full invasion process. If our analysis identifies traits that are related to the success of ant species in new environments, these traits should be more pronounced in the subset of invasive species.
Methods Geographic FocusWe focused on regions that are particularly well investigated with respect to exotic ants: 14 states of the U.S. (Alabama, Arizona, Arkansas, California, Florida, Georgia, Illinois, Louisiana, Mississippi, Missouri, North Carolina, Ohio, South Carolina, and Tennessee) and one state of Mexico (Baja California). This study area has definite and naturally given borders (e.g. coastlines) and is part of the Nearctic and Neotropic bioregion, with mean annual temperatures from 10° C in northern Illinois and northern California, to 25° C in southern Baja California and southern Florida (Geodata 2011). The area includes not only a wide range of temperatures but also a diversity of biomes, thus covering a broad range of conditions.
Species ListOur species list is based on the database
In a literature search until July 2009, we collected data on traits of the 416 ant species in our species list. The sources included scientific papers, books, websites, and personal communications with researchers (Appendix 1 and Acknowledgements). Synonyms and antiquated names of species were noticed. Tools for searching were Google, Google Scholar, Google Books, and the ISI Web of Science. The complete dataset with references for all data points is provided as Appendix 3. It includes 2536 data points from over 300 different sources; data on worker head width of 414 ant species were measured ourselves. The nine specific traits we analyzed are as follows:
A) Gyny – the degree of gyny, i.e. the number of reproductive queens (corresponding to assumption 1 mentioned in the Introduction; n = 226 species). We differentiated between obligate monogyny (only one functional queen; n = 103), obligate polygyny (two or more functional queens; n = 67), and facultative monogyny/polygyny (n = 56).
B) Colony size – the mean colony size, defined as the average number of workers in a colony (corresponding to assumption 2; n = 227). For exotic species, it is the average number of workers in colonies in both the native and exotic range. Since this trait only relates to the workers of each species, we excluded the two parasitic species Pogonomyrmex colei (Snelling) and Anergatus atratulus (Schenk) that do not have a worker caste.
C) Founding – how new nests are founded (n = 190), either by the queen alone (independent; n= 144), with the help of accompanying workers (dependent; n = 35), or a mix of these strategies (n = 11). The category “independent” includes claustral, semiclaustral, and pleometrotic founding strategies. The category “dependent” is applicable to species that found new nests via budding, splitting, sociotomy, or fission. This trait corresponds to assumption 3 in the Introduction, but to an extended version of this assumption, as only budding as a characteristic of exotic ants has been previously assumed and has thus been mentioned in the Introduction. We consequently extended assumption 3 to assumption 3a: Exotic ants form new nests more frequently in a dependent way than native ants. With respect to forming new nests, we additionally included information on social parasitism in our dataset:
D) Parasitism (n = 225) – we differentiated between facultatively or obligately parasitic species (n = 35; e.g. optional slaveholders, dulotic ants, or inquilines) and non-parasitic species (n = 190). We assumed that parasites, which depend on their host species being present in the exotic range, are found less frequently among exotic than among native species (assumption 3b).
The remaining traits only concern the workers of each species. As for colony size, we again excluded the two species Pogonomyrmex colei and Anergatus atratulus that do not have a worker caste.
E) Morphs – the morphology of the workers (n = 386) with the following categories: monomorphic (n = 265), dimorphic (n = 44), or polymorphic (n = 77) worker caste. This trait corresponds to assumption 4 in the Introduction. For testing assumption 5 on worker body size, we used data on head width and total body length. For simplicity, no differentiation was made between monomorphic, dimorphic, and polymorphic ant species here.
F) HW (head width; n = 414) – since literature values were only available for less than half of the species in our dataset (HW1; n = 178), we measured head width for all species ourselves, using the software ImageJ (2009). These measurements (HW2; n = 414) were carried out with digital photographs, showing the frontal view of workers. Following
G) TL (total body length) – an alternative measure of body size in ants is total body length (n = 313). We collected these data from the literature, thereby not discriminating between different methods to measure body length, as such information was often not provided.
H) Reproduction – the reproductive ability of workers (n = 179), discriminating workers that are sterile (n = 90; without ovarioles) from those that are potentially fertile (n = 89; able to produce males, trophic eggs, or are thelytoke, i.e. produce females). This trait corresponds to assumption 6.
I) Stinger (n = 388) – we discriminated workers with a functional stinger (n = 232) from those without a stinger or a rudimental or non-functional stinger (n = 156). This trait does not belong to an assumption mentioned in the Introduction. In fact, no clear assumption with respect to the frequency of a functional stinger in exotic as compared to native ant species can be found in the literature, possibly because two intuitively reasonable lines of thought lead to opposite expectations. On the one hand, a functional stinger represents a weapon that might be beneficial to survive in an exotic environment, hence one could expect that workers of exotic ants are more frequently equipped with a stinger than those of native ants. On the other hand, the stinger is a phylogenetically primary trait that has been secondarily lost in many ant species of derived clades (
For all metric literature data (colony size, HW1, and TL), we adopted means reported in the literature for a given species. If no mean but only an interval was reported (minimal and maximal limits for di- or polymorphic species; colony sizes for different colony ages), we calculated the mean by averaging the minimal and maximal value of each interval. If data for a given trait and species were available from more than one source, we calculated the mean by averaging across sources.
AnalysesComparisons were done between native (Nat) and exotic established (Exo) ants, and between native and exotic invasive (Inv) ants. We applied univariate analyses, multivariate analyses of the raw data, and multivariate analyses of phylogenetically corrected data. For the univariate analyses, we performed two different two-sample tests for each of our nine traits. In these tests, one sample consisted of Nat species; the other sample consisted ofExo species for the first test and of Inv species for the second test. In the multivariate analyses, the independent variables were the traits, and the dependent variable was the species category: Nat/Exo for the first comparison and Nat/Inv for the second comparison. In our analyses, we followed the approach taken by
A) For the univariate analyses, we ran two-tailed binomial tests for the binary variables parasitic, reproduction, and stinger; U-tests were done for the ordinal variables gyny, founding, and morphs; and t-tests for unequal variances were run for the metric variables HW, TL, and colony size.
B) As mentioned above, multivariate analyses can only consider those species for which data on all included variables are available. As our dataset includes empty cells, reducing the number of variables in the multivariate analysis increases the number of species in the analysis and thus the sample size. This is one reason why it is necessary to consider a priori knowledge and thoroughly think about which variables should be included in a multivariate analysis and which should be excluded; further reasons are given in Burnham and Anderson (2002). We excluded the variable TL (total body length), as it was available for fewer species than HW (head width), the other variable quantifying body size. We also excluded the variable parasitism from the multivariate analyses, as it was uninformative in the reduced dataset of the multivariate analyses: all species in the reduced dataset were non-parasitic. The remaining seven traits were included as independent variables in the multivariate analyses: gyny, colony size, founding, HW, morphs, reproduction, and stinger. The species list decreased to n = 70 for the comparison of native and exotic established ants, and to n = 60 for the comparison of native and exotic invasive ants. For all combinations of traits, but excluding interactions, we calculated multiple logistic regressions (due to our binary dependent variables: Nat, Exo, and Inv). For each of the two comparisons, we thus calculated 27 – 1 = 127 regression models. We evaluated the models by means of AICc values (Akaike’s information criterion corrected for small sample size, Burnham and Anderson 2002).
C) As our data quantify traits of species that are phylogenetically related to each other, they are not independent of each other. To correct for this phylogenetic dependence, we calculatedphylogenetically independent contrasts (Felsenstein 1985;
The above mentioned existing assumptions on differences between exotic and native ant species are supported by the univariate analyses. As expected, ant species that are exotic in North America (Exo and Inv) are more often polygynous than native (Nat) species (assumption 1; Fig. 1a; for both comparisons, Nat vs. Exo and Nat vs. Inv, p < 0.001) and form new nests more frequently in a dependent way (assumption 3a; Fig. 1b; both p < 0.001). Social parasitism is infrequent among all ant species but especially rare among exotic established (3%) and invasive (0%) species (native species: 20%; assumption 3b; Fig. 1c; both p < 0.001). Workers of exotic ants are mostly monomorphic, whereas those of native species tend to be more polymorphic (assumption 4; Fig. 1d; p < 0.001 and p < 0.05, respectively). Furthermore, head widths of exotic established (mean = 0.725 mm; SE = 0.037) and invasive species (mean = 0.699 mm; SE = 0.050) are significantly smaller than those of native species (mean = 1.051 mm; SE = 0.032) (assumption 5; Fig. 2a; both p < 0.001). As expected, the differences for total body length (TL) are similar to those of head width: workers of exotic established (mean = 2.99 mm; SE = 0.17) and invasive species (mean = 2.81 mm; SE = 0.24) have significantly shorter bodies than those of native species (mean = 4.22 mm; SE = 0.13) (both p < 0.001). Sterility is more frequent among workers of exotic established (78%) and invasive (93%) species than among natives (40%) (assumption 6; Fig. 1e; both p < 0.001). Finally, colonies of exotic established (mean ≈ 123037; SE ≈ 63591) and invasive species (mean ≈ 136777; SE ≈ 87659) are larger than those of native species (mean ≈ 6265; SE ≈ 1688) (assumption 2; Fig. 2b), but differences are not significant here. Please note that colony size is highly variable, however, ranging from five individuals to millions of workers for the species analyzed here. Thus, all assumed trait differences (assumptions 1–6) are shown by the data and are significant in the univariate analyses except for colony size which is highly variable. Still, the trend shown by the data for colony size is in the assumed direction. Also as expected, differences between exotic and native species are usually more pronounced if only exotic invasive species are compared with the native species. With respect to the presence of a functional stinger, workers of exotic established (72%) and invasive (76%) ants are significantly more frequently equipped with a functional stinger than those of native species (56%) (Fig. 1f; both p < 0.01).
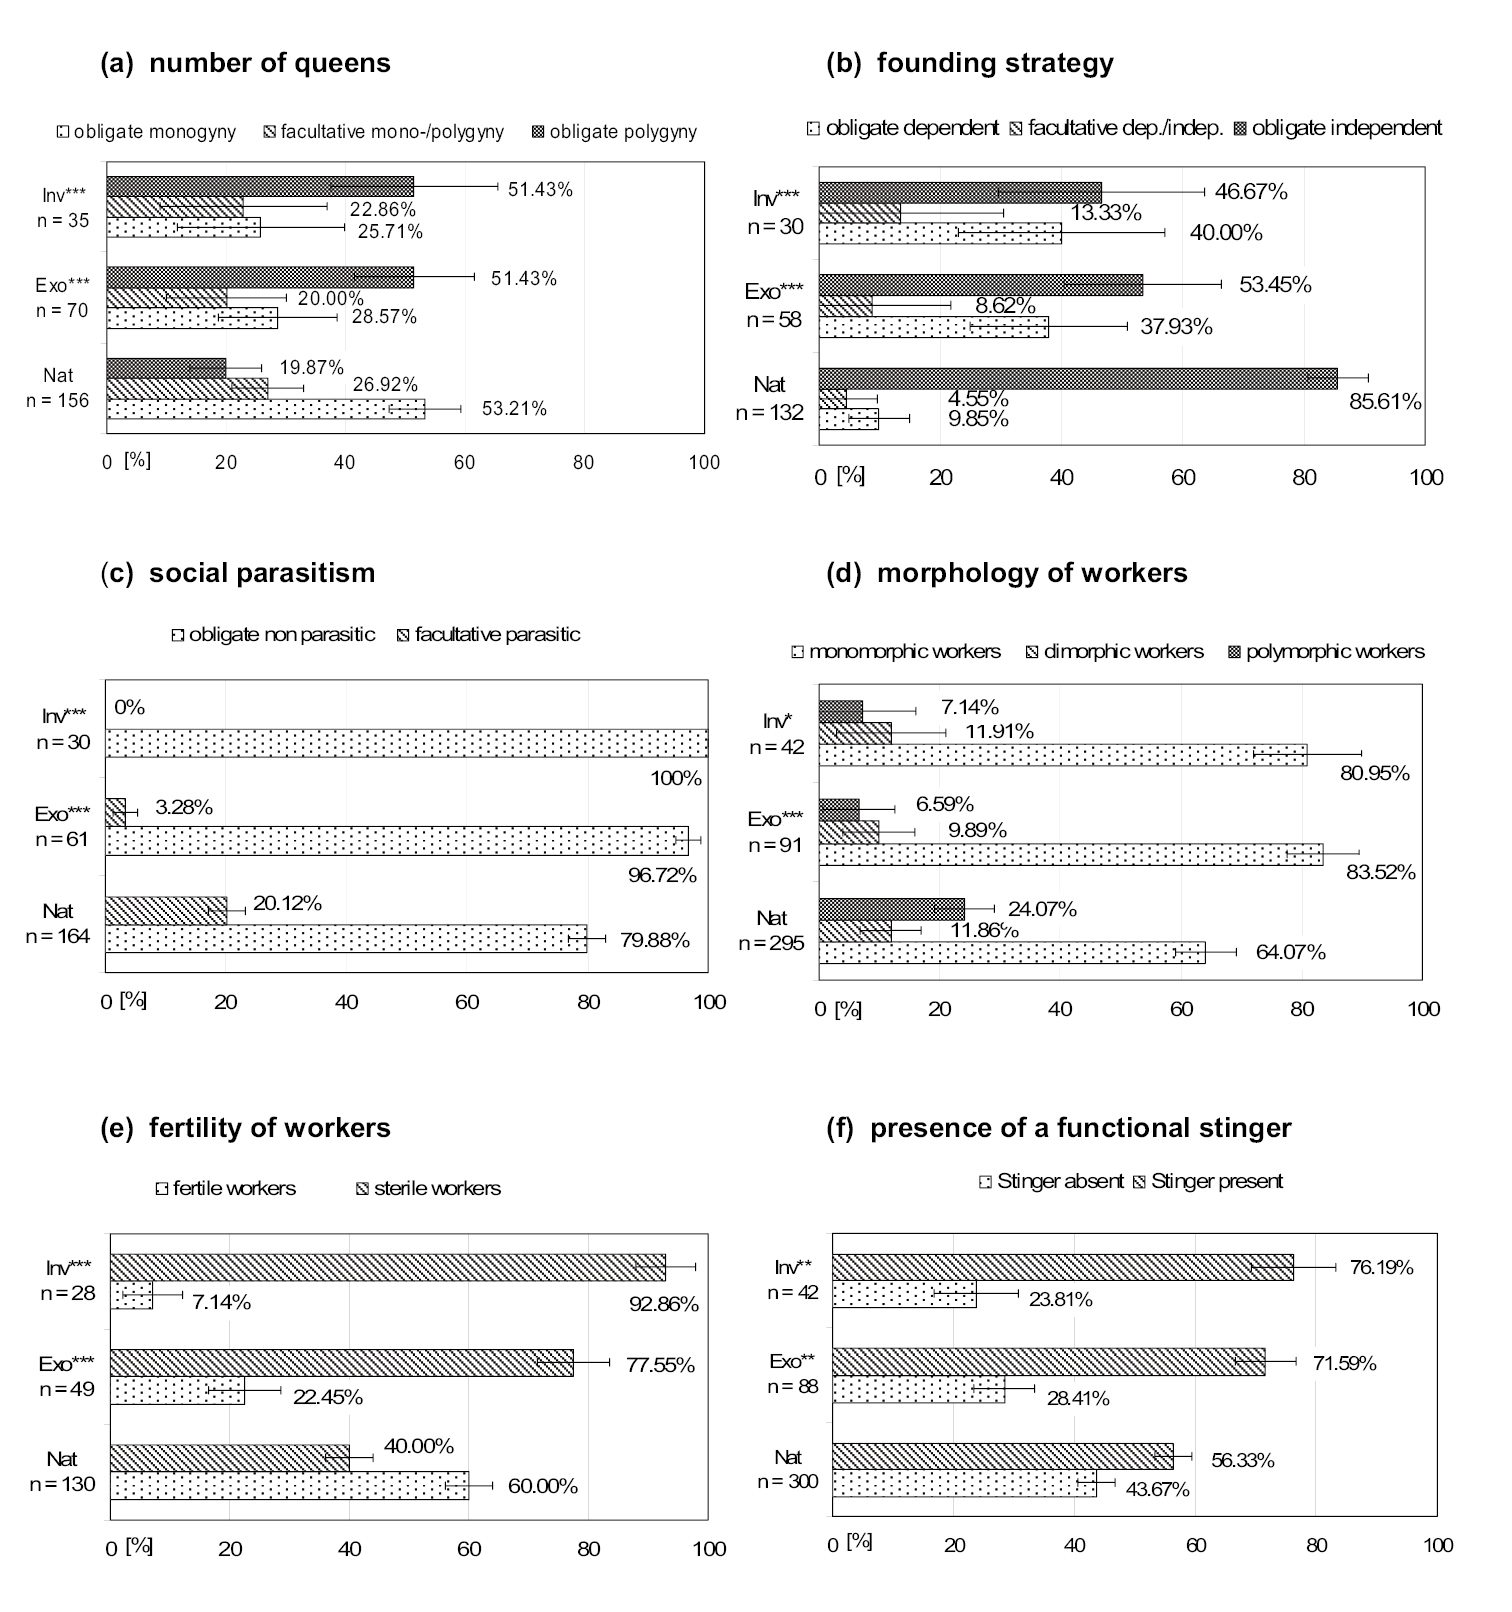
Results of univariate analyses, categorical traits. Differences among native (Nat), exotic established (Exo), and exotic invasive (Inv) ants in North America. Illustrated are means ± SE. Asterisks indicate significant differences between native and exotic established species, and between native and exotic invasive species: ***p < 0.001, **p < 0.01, *p < 0.05.
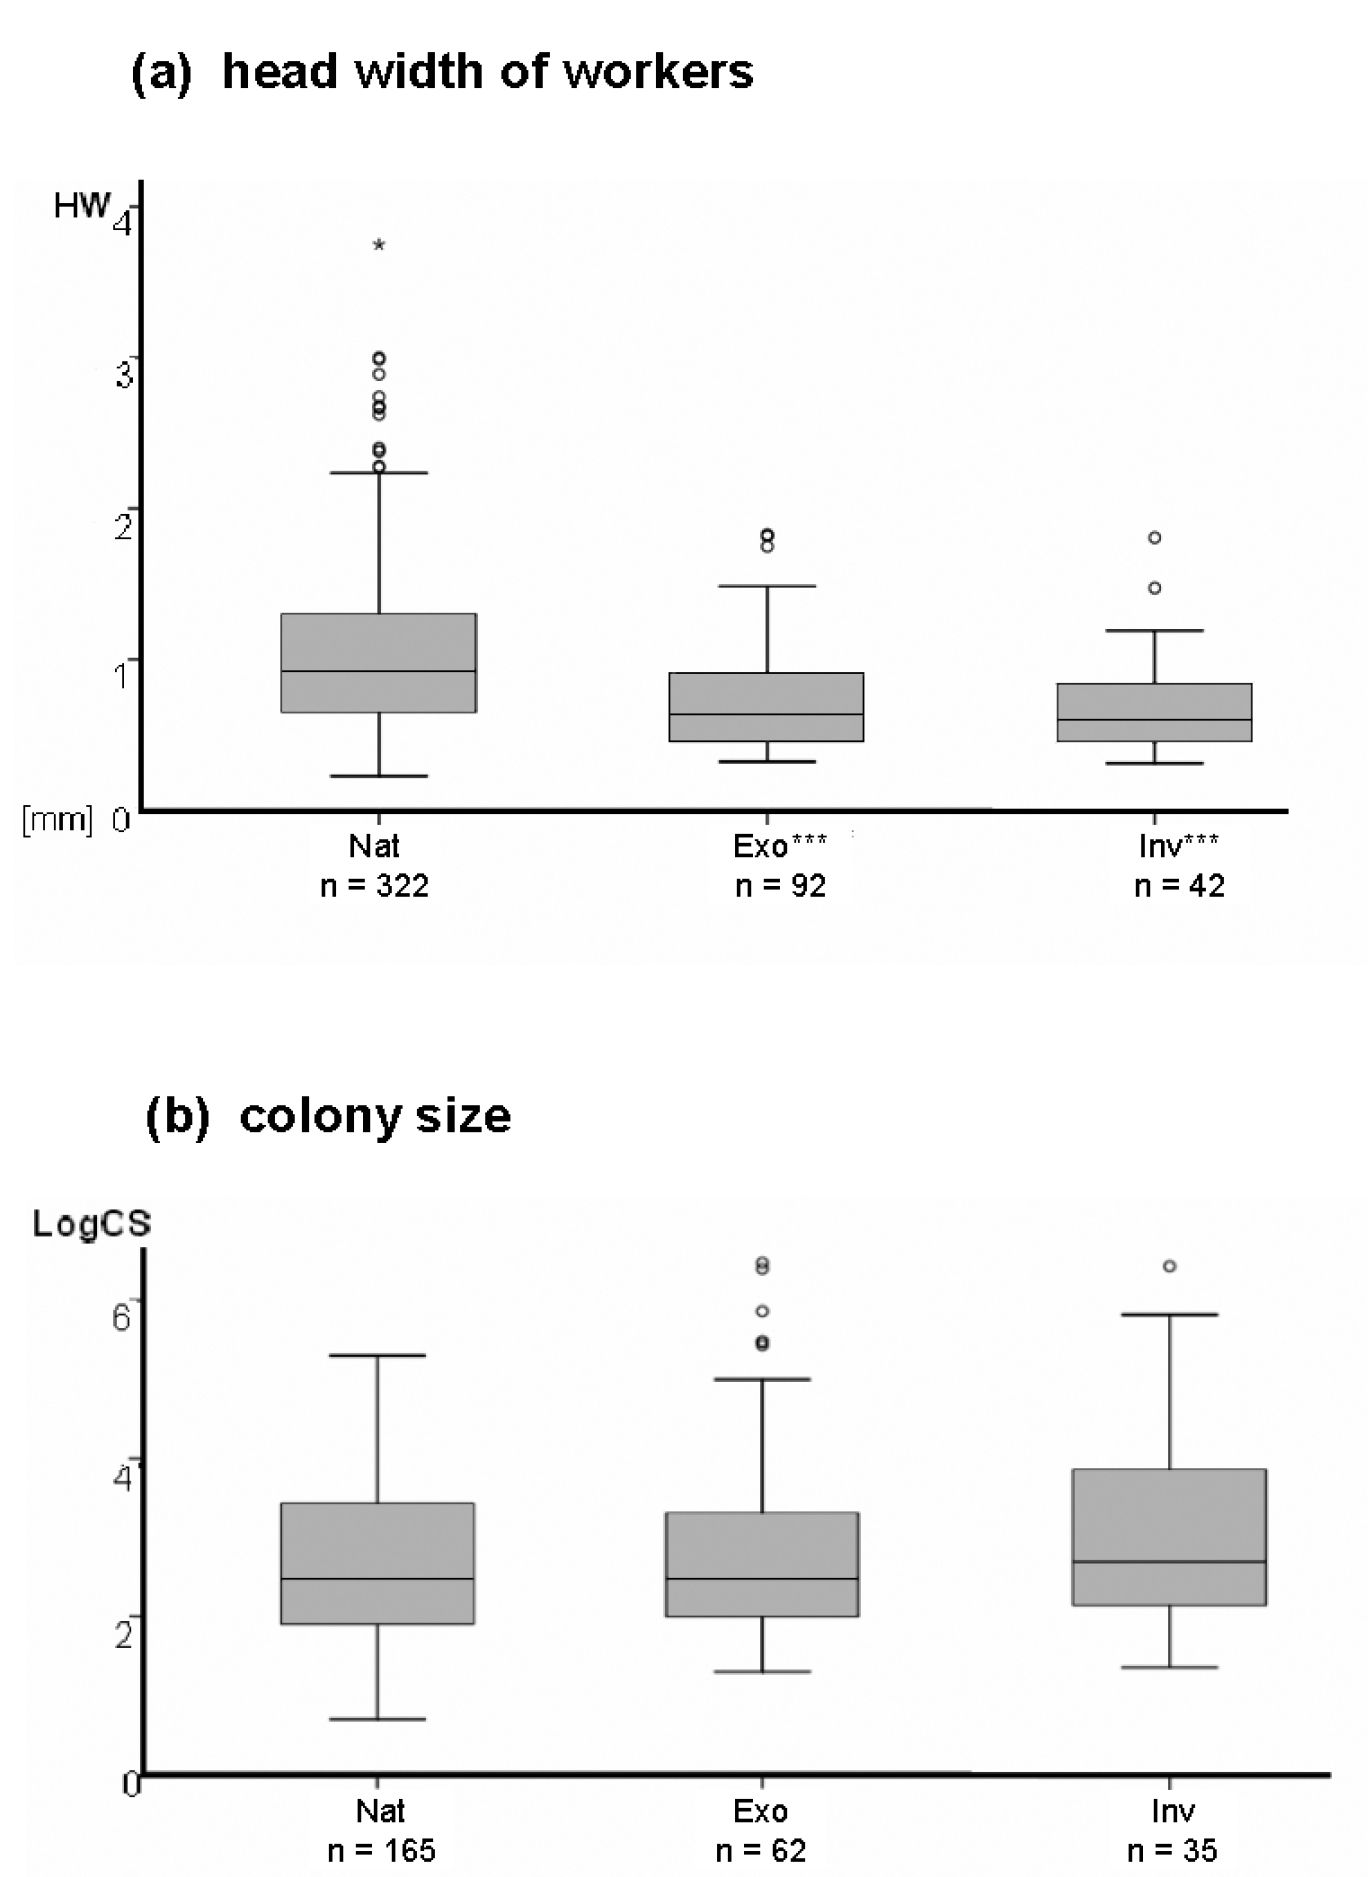
Results of univariate analyses, metric traits. Differences among native (Nat), exotic established (Exo), and exotic invasive (Inv) ants in North America. Asterisks indicate significant differences between native and exotic established species, and between native and exotic invasive species: ***p < 0.001 a Nat: median = 0.923 (range: 0.227 to 3.750), mean = 1.051 (SE = 0.032); Exo: median = 0.633 (range: 0.322 to 1.828), mean = 0.725 (SE = 0.037); Inv: median = 0.609 (range: 0.323 to 1.818), mean = 0.699 (SE = 0.050) b Nat: median = 296 (range: 5 to 200000), mean = 6265 (SE = 1688); Exo: median = 300 (range: 20 to 3000000), mean = 123037 (SE = 63591); Inv: median = 550 (range: 25 to 3000000), mean = 136777 (SE = 87659); differences between Nat and Exo (p = 0.071) and Nat and Inv (p= 0.146) were not significant here. Please note that the y-axis is log10-scaled here.
Only multivariate analyses can reveal the relative importance of traits to differentiate between exotic and native ant species. In the four types of multivariate analyses that we performed, the only variable that is included in all models with substantial empirical support (Akaike weight ωi ≥ 0.05, Table 1) is colony size, suggesting that a large colony size is the most important characteristic of exotic ants as compared to native ants in North America. The mode of colony founding and the reproductive ability of workers also appear to be particularly important variables to differentiate between exotic and native ant species, as they are included in many models with substantial empirical support. The remaining variables seem less important.
Results of multivariate analyses. Shown are multivariate regression models with substantial empirical support, i.e. with Akaike weights ωi ≥ 0.05, calculated on the basis of Δi AICc values which are shown as well. Models with low empirical support, i.e. with Akaike weights ωi < 0.05, are not shown. Each regression model compared native ants with either exotic established or exotic invasive ants, as indicated. Model inputs were either raw data or phylogenetically independent contrasts, also as indicated. Each model included the given variables’ main effects.
| Model (variables included) | Δi AICc | ωi |
|---|---|---|
| Exotic established ants, raw data | ||
| Colony size, founding, reproduction, morphs | 0 | 0.203 |
| Colony size, founding, reproduction, morphs, gyny | 0.267 | 0.178 |
| Colony size, founding, reproduction, morphs, HW | 0.686 | 0.144 |
| Colony size, founding, reproduction, morphs, gyny, HW | 1.879 | 0.079 |
| Colony size, founding, reproduction, morphs, stinger | 2.467 | 0.059 |
| Colony size, founding, reproduction, morphs, gyny, stinger | 2.568 | 0.056 |
| Exotic established ants, independent contrasts | ||
| Colony size, founding | 0 | 0.089 |
| Colony size, founding, reproduction | 0.983 | 0.055 |
| Colony size, founding, stinger | 1.011 | 0.054 |
| Exotic invasive ants, raw data | ||
| Colony size, founding, reproduction, morphs, gyny | 0 | 0.428 |
| Colony size, founding, reproduction, morphs, gyny, stinger | 1.268 | 0.227 |
| Colony size, founding, reproduction, morphs, gyny, HW | 2.350 | 0.132 |
| Colony size, founding, reproduction, morphs, gyny, HW, stinger | 3.752 | 0.066 |
| Exotic invasive ants, independent contrasts | ||
| Colony size, reproduction | 0 | 0.202 |
| Colony size, reproduction, HW | 1.264 | 0.107 |
| Colony size, reproduction, founding | 1.762 | 0.084 |
| Colony size, reproduction, morphs | 2.267 | 0.065 |
| Colony size, reproduction, gyny | 2.295 | 0.064 |
| Colony size, reproduction, stinger | 2.300 | 0.064 |
We examined traits of exotic and native ant species in North America in order to test previously postulated but insufficiently tested assumptions on the characteristics of exotic ant species. Our results support all investigated assumptions. Thus indeed, colonies of exotic ant species have more reproducing queens (polygyny; assumption 1) and more workers (assumption 2) than colonies of native species; they form new nests more frequently in a dependent way than native species (assumption 3a); parasites are found less frequently among exotic than among native species (assumption 3b); and the workers of exotic species are more frequently monomorphic (assumption 4), smaller (assumption 5), and more frequently sterile than the workers of native species (assumption 6). As expected, differences between exotic invasive and native species are more pronounced and in the same direction than differences between exotic established and native species.
Of the six assumptions, only assumptions 2 and 5 were, to our knowledge, previously tested (see Introduction). Assumption 2, which says that exotic ant species tend to form larger colonies than native species, has been previously tested by
Our results also support assumption 5, which says that the workers of exotic ant species are smaller than those of native species, and are in line with previous tests of this assumption by
Our results show that exotic ants have a suite of characteristics that separate them from the native ant fauna of North America (Table 2). The most important of these characteristics is, according to our multivariate analyses, colony size, followed by the founding strategy and reproductive ability of workers. Indeed, the univarate tests for differences in colony size were not significant, whereas the multivariate analyses identified this variable as the most important characteristic of exotic ants in North America. The non-significant results of the univariate analyses are less surprising when considering the huge variation in this trait, ranging from five individuals to several millions. Still, the trend shown by the univariate analyses was consistent with the multivariate analyses that exotic ant species have larger colonies than native species. Also, more weight should be put on the multivariate analyses, for the reasons given above in the Methods section. Within exotic species, there was a trend that exotic invasive species have larger colonies than exotic established species. It is reasonable that larger colonies have an advantage over smaller ones, especially when they are competing or even fighting with each other. A challenge with colony size is data availability: as the size of a colony depends on its stage (founding stage, ergonomic stage, or reproductive stage;
Summary of the combined results. Listed is the suite of traits that characterize exotic as compared to native ants, based on this study’s results.
| Characteristics of exotic ants |
|---|
| Large colony size |
| New nests founded by queen with workers† rather than queen alone |
| Not socially parasitic on other ants |
| Sterile workers |
| Monomorphic workers |
| More than one queen per colony (polygyny) |
| Small body size |
| Equipped with a functional stinger |
†Dependent nest founding, either via budding, splitting, sociotomy, or fission.
In addition to colony size, the sterility of workers is an important characteristic of exotic ant species in North America, which is in line with the literature (
Besides testing previously postulated assumptions, we also investigated if workers of exotic ant species differ from those of native ant species in the presence of a functional stinger. Our analyses revealed such a difference, showing that workers of exotic ant species are more frequently equipped with a functional stinger than workers of native ant species. Within exotic species, a functional stinger is more frequent in exotic invasive than exotic established species. These findings support the line of thought mentioned above that a functional stinger is a weapon that helps to survive in an exotic environment. Our dataset also showed a significant relationship of stinger presence with worker body size: workers of species with a functional stinger are smaller (mean head width in mm = 0.788, SE = 0.026, n = 232) than those of species without a functional stinger (mean = 1.259, SE = 0.052, n = 156) (p < 0.001, two-tailed t-test for unequal variances). Thus, species with large workers appear to often have lost their stinger in the course of evolution, probably because their large size is sufficient to be competitive. In species with small workers, on the other hand, the stinger may at least partly compensate for the size disadvantage.
A weakness of our dataset is that it does not include information on ant species that were introduced to North America but did not establish there. Even although sub-samples of ant species introduced to North America exist (
Another weakness of this study is that it can only provide correlative patterns rather than causative findings. For example, our finding that exotic ants have larger colonies than native ants does not necessarily imply that they successfully established because they form larger colonies. Despite limitations of this study, it may nonetheless contribute to a better understanding of exotic ant species. Together with a few other studies, this study also sheds light on differences between native and exotic invertebrates. Combining these differences with those found for vertebrates and plants will substantially improve our understanding of the general characteristics of exotic as compared to native species.
We thank S. Foitzik, K. Ivanov, R.A. Johnson, L. Keller, J.T. Longino, T. McGlynn, J. Ness, G.C. Snelling, P.S. Ward, and V. Witte for providing us with important advice and information. J.D. Olden, V. Witte, and two anonymous reviewers provided comments on the manuscript. Financial support was received from the Deutsche Forschungsgemeinschaft (JE 288/2-1, JE 288/4-1).
Literature sources. (doi: 10.3897/neobiota.10.1047.app1) File format: PDF.
Explanation note: This file lists all literature sources for our dataset, phylogeny, and species list.
Copyright notice: This dataset is made available under the Open Database License (http://opendatacommons.org/licenses/odbl/1.0/). The Open Database License (ODbL) is a license agreement intended to allow users to freely share, modify, and use this Dataset while maintaining this same freedom for others, provided that the original source and author(s) are credited.
Citation: Wittenborn D, Jeschke JM (2011) Characteristics of exotic ants in North America. NeoBiota 10: 47–64. doi: 10.3897/neobiota.10.1047.app1
Species list. (doi: 10.3897/neobiota.10.1047.app2) File format: PDF.
Explanation note: This file lists all species included in our analyses. The species are subdivided into native, exotic established, and exotic invasive ant species.
Copyright notice: This dataset is made available under the Open Database License (http://opendatacommons.org/licenses/odbl/1.0/). The Open Database License (ODbL) is a license agreement intended to allow users to freely share, modify, and use this Dataset while maintaining this same freedom for others, provided that the original source and author(s) are credited.
Citation: Wittenborn D, Jeschke JM (2011) Characteristics of exotic ants in North America. NeoBiota 10: 47–64. doi: 10.3897/neobiota.10.1047.app2
Dataset. (doi: 10.3897/neobiota.10.1047.app3) File format: Excel spreadsheet (xls).
Explanation note: This file provides our complete dataset with references for all data points.
Copyright notice: This dataset is made available under the Open Database License (http://opendatacommons.org/licenses/odbl/1.0/). The Open Database License (ODbL) is a license agreement intended to allow users to freely share, modify, and use this Dataset while maintaining this same freedom for others, provided that the original source and author(s) are credited.
Citation: Wittenborn D, Jeschke JM (2011) Characteristics of exotic ants in North America. NeoBiota 10: 47–64. doi: 10.3897/neobiota.10.1047.app3