| Taxon names | Citations | Turn highlighting On/Off |


(C) 2012 Sabrina Kumschick. This is an open access article distributed under the terms of the Creative Commons Attribution License 3.0 (CC-BY), which permits unrestricted use, distribution, and reproduction in any medium, provided the original author and source are credited.
For reference, use of the paginated PDF or printed version of this article is recommended.
The number of invasive alien species is increasing and so are the impacts these species cause to the environment and economies. Nevertheless, resources for management are limited, which makes prioritization unavoidable. We present a prioritization framework which can be useful for decision makers as it includes both a scientific impact assessment and the evaluation of impact importance by affected stakeholders. The framework is divided into five steps, namely 1) stakeholder selection and weighting of stakeholder importance by the decision maker, 2) factual description and scoring of changes by scientists, 3) evaluation of the importance of impact categories by stakeholders, 4) calculation of weighted impact categories and 5) calculation of final impact score and decision making. The framework could be used at different scales and by different authorities. Furthermore, it would make the decision making process transparent and retraceable for all stakeholders and the general public.
stakeholder, decision maker, exotic, generic scoring system, impact, value
Impacts of invasive alien species (IAS) affect different receptor environments, and are often divided into environmental and socio-economic impacts. Some of these impacts can result in substantial monetary costs and/or alterations to entire ecosystems and social systems (
There has been recognition that societies need to mitigate negative impacts of IAS, i.e. find appropriate means to manage IAS in a way that their impacts are at least minimized, e.g. by eradication, reduction below a specific threshold, or containment. However, resources to manage IAS are limited and with increasing globalization, the influx of potentially harmful organisms will likely continue to increase (
Alien species, however, do not have only negative effects. The majority of the alien plants in Europe were deliberately introduced, e.g. as ornamental, horticultural, restoration, agricultural or forestry species (
At present, several studies have proposed prioritization methods for the management of weeds (e.g.,
The basic problem with many of the systems to date is a fundamental one. Decisions made for IAS management are heavily influenced by judgements which are predominantly based on inputs from scientists (
Here, we propose a comprehensive framework which aims to explicitly separate the scientific description of changes caused by IAS from the value systems of affected stakeholders who may have differing interests. Furthermore, it addresses both negative and positive effects of IAS, since positive effects are often neglected in purely ecological impact studies (
The framework suggested here is divided into five steps. The different steps are shortly introduced in this section. We then present more details about the scorings and values in the following sections and in Figures 1 and 2.
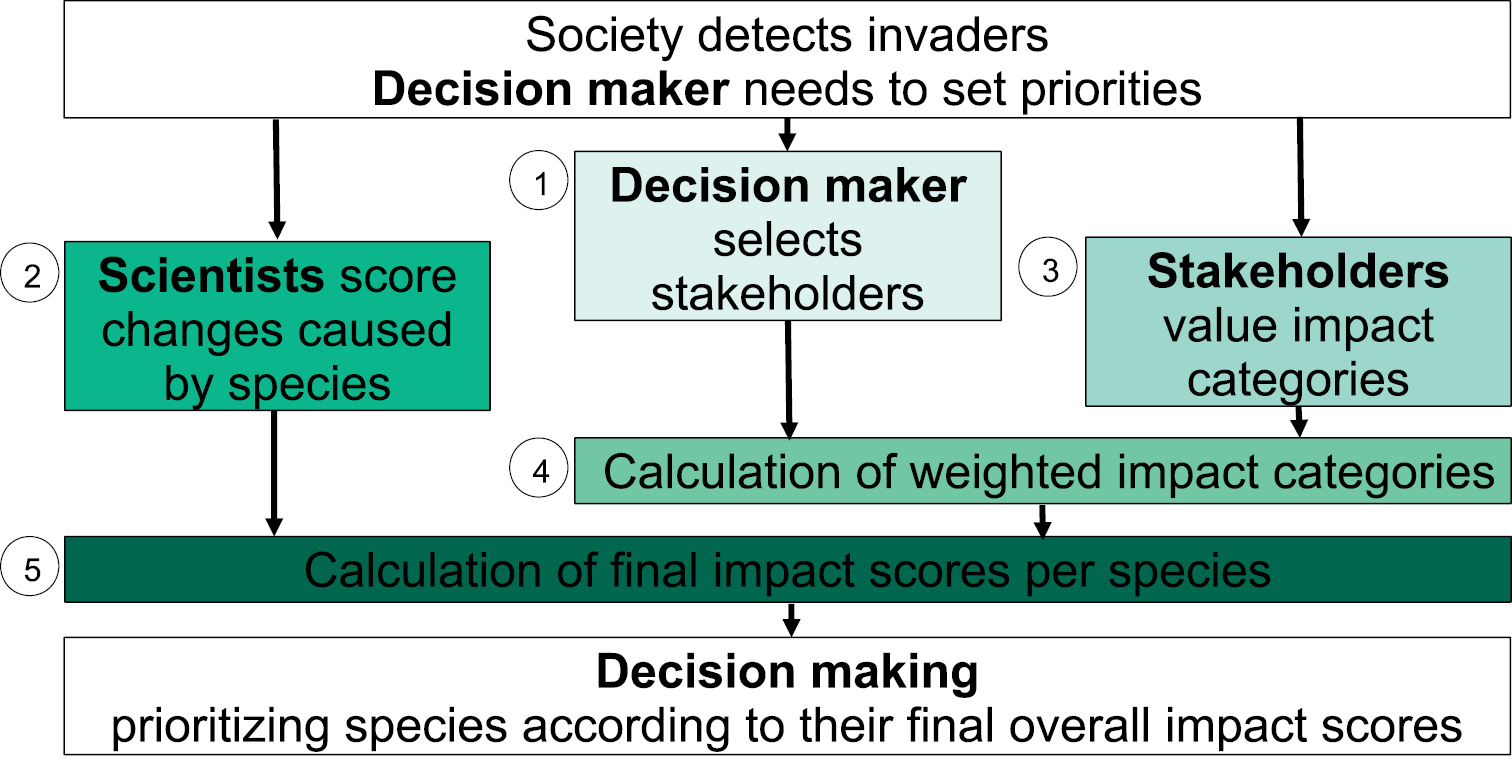
Schematic overview of the conceptual framework to assess change in different impact categories for each species, capture stakeholders’ interests and weigh stakeholders and calculate a final impact score for each species, see chapter “framework for impact evaluation” of IAS for a brief and the following chapters for detailed explanation.
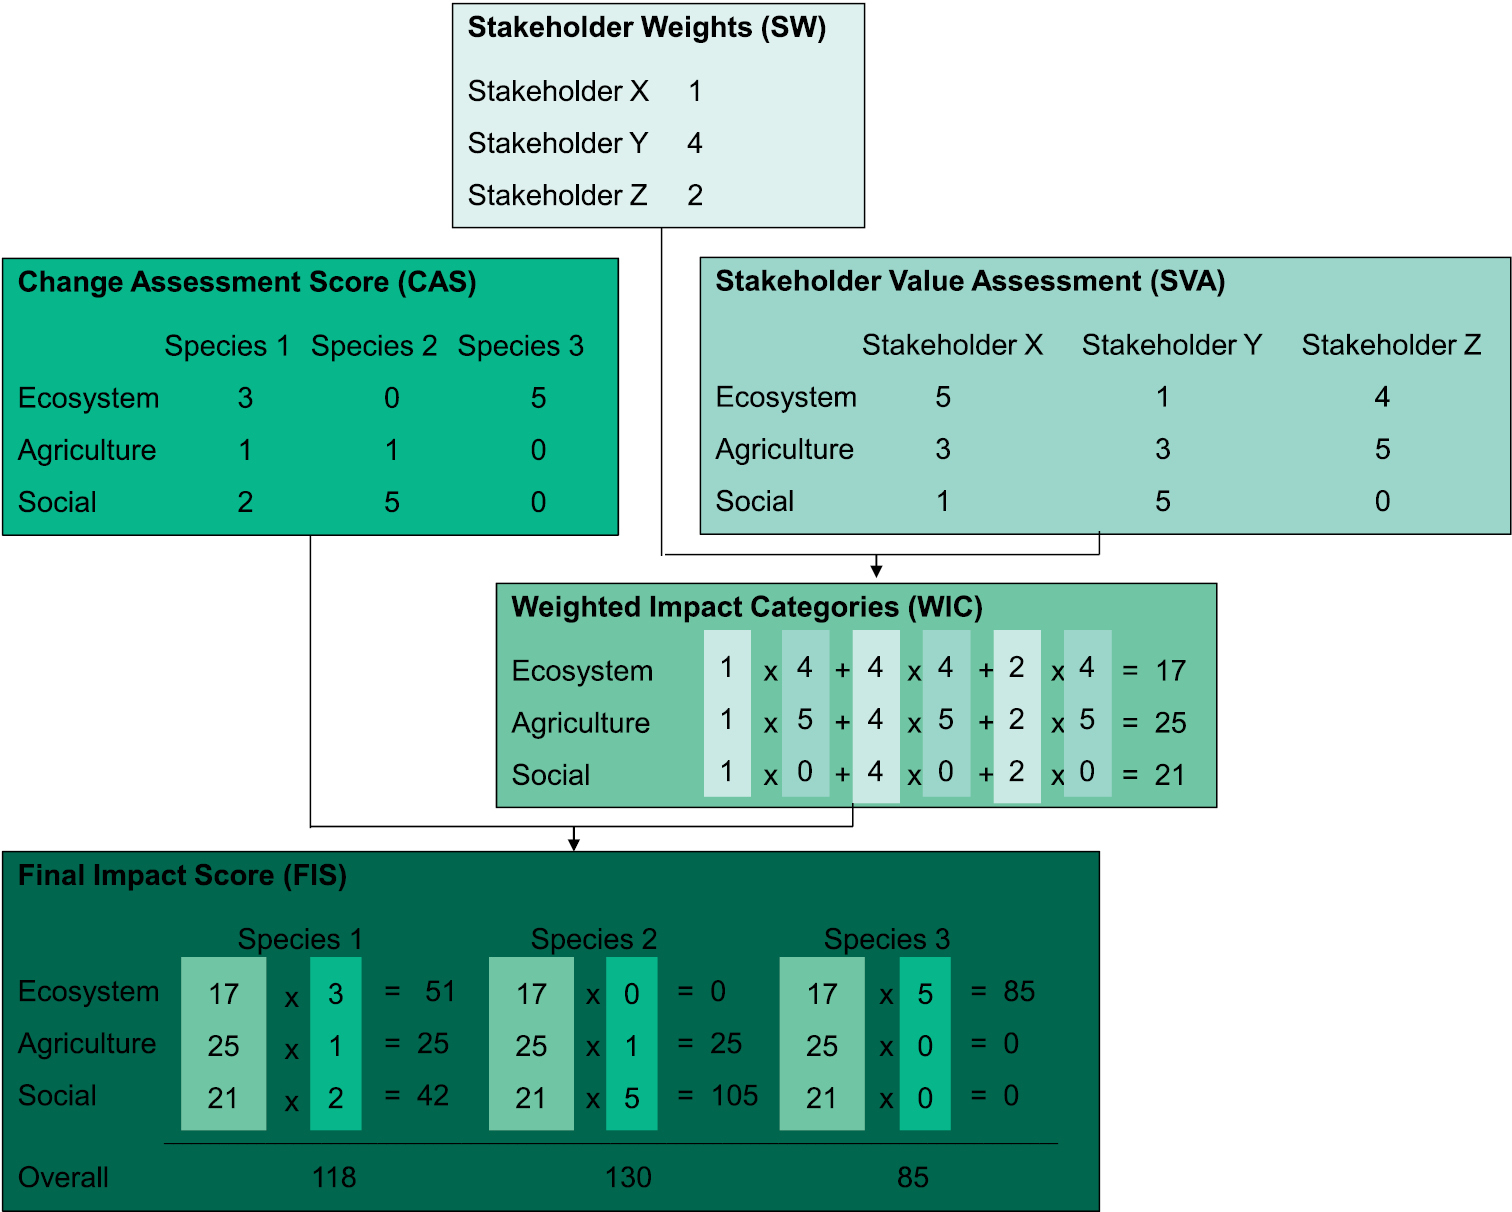
Fictitious example on how to calculate the different values of the prioritization framework. For brevity, we limit the number of categories from the scientific impact assessment in Step 2 of the framework to 3 (out of 24). Species 2 has the highest social Change Assessment Score (CAS), whilst species 3 has the highest CAS for ecosystem changes. The decision maker gives stakeholder Y the greatest weighting. In the Stakeholder Value Assessment (SVA), stakeholder X gives the greatest value to ecosystem, whilst Y values the social category the highest, and stakeholder Z values agriculture most. Multiplying these values by the stakeholder weights and summing the products gives Weighted Impact Categories (WIC), and multiplying these values by respective category CAS values gives the final overall impact scores per species. Note that WIC values for positive change need to be inversed to negative values upon calculation of final impact scores per category and overall.
Step 1: Stakeholder selection and weighting of stakeholder importance. A call for stakeholder participation is launched and they are encouraged to claim their interest. The stakeholder group is formed such that it is sufficiently representative and appropriate for the task at hand. The participating stakeholders are then categorized according to their importance in relation to the issue that is being evaluated. This process produces Stakeholder Weights (SW), and should be conducted in a transparent and logical way.
Step 2: Description and scoring of changes due to IAS. For this step we propose a scoring system, based on two main impact classes (ecological, socio-economic) each with several categories (e.g., agriculture, health, infrastructure, herbivory, hybridization). Negative and positive changes are separately evaluated for each IAS. The outcome of this step is hereafter referred to as Change Assessment Score (CAS).
Step 3: Valuing the relative importance of impact categories by stakeholders. After identifying affected stakeholders in step 1, each stakeholder values the relative importance of all impact categories. Negative and positive categories are valued separately. When valuing the categories, the stakeholders do not know the species assessed in step 2 and their change assessment scores. This is called Stakeholder Value Assessment (SVA).
After selection of stakeholders (step 1), the description of changes (step 2) and the assessment of stakeholder weights (step 3) can be conducted at the same time as one does not depend on the outcome of the other. The following steps in turn can only be performed if the outcomes of the former steps are known.
Step 4: Calculating weighted impact categories. This is done by combining the outcomes of step 1 and step 3, which produces Weighted Impact Categories (WIC).
Step 5: Final impact scores.The Final Impact Scores (FIS) for each species are calculated by combining the CAS (step 2) with WIC (step 4).
In the following sections, the five steps are described in detail, and in the final part of the paper the usefulness of the scheme for different potential end-users and advantages and potential shortcomings are discussed.
Prioritizing scheme in five steps, describing the action taken at each step, identifying the actor of each step and defining the output of each step. *) can be performed simultaneously.
| Step | Action | Actor | Output |
|---|---|---|---|
| 1) | Decision maker chooses the stakeholders and decides on the form and execution of the weighting process | Decision maker | SW = Stakeholder Weights |
| 2*) | Assessment of change: the change a species incurs for each category from App. A is scored | Scientists | CAS = Change Assessment Score |
| 3*) | Stakeholders value each category from App. A, regardless of the species and change a species incurred | Stakeholders | SVA = Stakeholder Value Assessment |
| 4) | Calculation of weighted impacts by combining SVA × SW | Decision maker (or scientists or consultant) | WIC = Weighted Impact Categories |
| 5) | Calculation of final impact score<br/> WIC × CAS | Decision maker (or scientists or consultant) | FIS = Final Impact Score |
Stakeholders play a central role in the presented scheme, as their opinions are crucial for evaluating the subjective impact categories through formal and structured analysis. The stakeholder process needs to be carefully planned, structured and conducted, accounting for the aim and needs of the problem at hand (
A stakeholder is – put simply – someone who can affect or is affected by the issue at stake (Freeman 1984, cited in
One main issue regarding the stakeholder process is the form of opinion-forming: is the process aiming at a consensus through deliberation, or are the stakeholders just asked for their individual opinion? If a consensus is sought for, the result of the process in our case would be a single set of weights (see step 3) that could directly be used to weigh the species impacts (resulting from step 2). If each stakeholder is allowed to have their own weights, then these need to be aggregated in some way unless the analysis is to be conducted separately for each stakeholder. A simple way is to average all the weights, in which case each stakeholders’ opinion is valued equally. However, if the decision maker wishes to weigh the stakeholder opinions, specific weights for each stakeholder need to be produced.
There are both ethical and pragmatic reasons why the decision maker should attend more closely to some stakeholders than others (
Categorization provides the decision maker with the possibility to influence the prioritization procedure by weighting each of the participating stakeholders. As this may be considered as a source of bias, it should be transparent and ideally based on objective and reliable analysis of stakeholders’ attributes (
Weighting is not a straightforward process, especially when numerous attributes of the stakeholders are taken into consideration, and when stakeholders’ external environment and interactions are complex (
The second step of the decision making process aims at recording all changes an IAS causes in the introduced range. An impact or change in this case is defined as any deviation from the state of a system before the invasion happened. In order to make comparison between species, different locations and different measurements of impact, we suggest the use of a generic scoring system (e.g.,
Based on previously published scoring systems (e.g.,
The socio-economic categories are changes to human health, infrastructure, animal production, agriculture, forestry and human social life. Socio-economic changes can also be negative or positive, depending on whether they decrease or increase human well-being. Negative changes often consist of direct monetary or utility losses and can range from no changes (score 0) to the maximum negative change possible (score 5). Positive effects are also possible, for example, more possibilities for hunting an invasive species whilst alleviating hunting pressure on native mammals, or provision of a nectar source for important pollinators of agricultural crops. These effects can also range from very low (score +1) to the highest positive effects possible (score +5). Again, we have positive and negative changes within the same category, but we score these separately because they might occur through different mechanisms.
Not all changes are equally relevant for different taxa. For example, the difference in changes between alien plants and animals is likely to be quite marked in some cases. Therefore, we propose not to use the scores of change (“impact” scores) as measurement themselves, but to calculate the percentage score achieved out of the maximum possible for a given species. Hence if plants and animals are to be assessed in the same prioritization round, then for questions which are not relevant for plants or animals respectively (e.g. ecological impact through predation for plants), the overall-score should be adjusted by calculating the percentage score achieved out of the maximum attainable score for the species, and then multiplying by the maximum score attainable among all species considered. The critical point here is that in any round of prioritization, each candidate species should have an equal opportunity of attaining the same maximum score possible.
In many cases, effects of IAS on the recipient environment and economy have not been thoroughly studied. As in the whole invasion process, the uncertainty level of impacts can therefore be high and communicating these uncertainties is crucial in the decision making process (
At this stage, we will leave the domain of objective quantification again and focus on the societal context. Scientific measurements of impact are valued differently by different stakeholders and the valuation may differ in space and time and from case to case (
The approach we suggest here (as vizualised in Figures 1 and 2) would be to let each stakeholder group give scores to each impact category according to their perceived importance for them. For example, for an impact assessment of alien species in a city, two possible stakeholder groups might be the tourism industry and environmentalists. The tourism industry is likely to assign the highest scores to the positive category on human social life, while environmentalists might give highest priority to the negative categories of change in ecosystems in general and on other species (e.g. through competition). There are a few studies on invasive species that explicitly weight the different assessment criteria (
We propose a fixed point scoring method to rank the importance of the categories by giving the stakeholders a fixed amount of points (e.g. 100) to freely distribute among the impact categories. This would reflect their preferences, but it is also good to note that if the stakeholders have extreme agendas, they might also end up with extreme point allocations. As mentioned, there are other mechanisms that could alternatively be used, for instance scoring each category at scale 1-5, and possibly also a combination of these. However, whatever the procedure, the stakeholders need to be given clear instructions on what is expected of them.
As indicated in the previous section, negative and positive categories are valued separately. When valuing the categories, the stakeholders do not know the Change Assessment Scores (CAS) of the alien species assigned by scientists in step 2, neither do they know which species are being assessed in order to avoid biased valuation towards certain species. In the same line of argument, stakeholders begin the valuation scoring without knowing the scores or even the participation of other stakeholder groups. If further deliberation in the stakeholder process is desired, it may follow this initial valuation.
For each stakeholder, the values of each impact category are multiplied with the weight score given to this stakeholder by the decision maker. For example, two stakeholders, named A and B here, assign 2 and 5 points, respectively to the category “agriculture”. The decision maker weights the opinion of stakeholder A as 3 times higher than the opinion of stakeholder B, thus the impact scores of A are multiplied by a factor 3 while those of B remain unchanged (see Figure 2 for another example). The overall weighted impact score for the category “agriculture” would in this example receive a score of 2 × 3 + 5 × 1 = 11. This procedure yields weighted impact values for each category, incorporating the value system of all stakeholders and their importance for the decision maker. The highest weighted impact values represent the categories that are valued most across all stakeholders, i.e. those categories in which impacts would have the most serious effects for society.
The final impact scores for each species are calculated by multiplying the Change Assessment Scores (CAS) for each impact category (step 2, Figure 1) by the Weighted Impact Categories (WIC) over all stakeholders (step 4, Figure 1). This procedure essentially combines the objectively measured impact with an overall valuation of this impact by society. To calculate an overall impact score for a species, all final impact scores are summed. It should be noted here that upon calculation of the weighted impact scores, the sign of the CAS should be inverted to negative values, so that the final summed impact score reflects the net perceived impact of a given species. For example, if a high scoring negative-change species has a high positive-change score in one category, and the major stakeholders rank this positive change highly, then the finally obtained impact score will be reduced by the larger positive weighted impact score. The same procedure is applied for the associated certainty scores. We would therefore also learn about the combined certainty attached to the impact scores. Species can then be ranked according to their overall impact scores and/or by the certainty of the scores. Species responsible for large changes in an impact category that is of relatively low value to society are down-weighted, while species scoring low in impact categories that are of high societal value are given more weight (Figure 2). These final overall impact scores are a crucial element in the prioritization of management, amongst others like cost-effectiveness.
Conservation organizations, governments and other interest groups need to prioritize which species to spend limited funds on in order to manage and achieve the best socio-economic and ecological benefit. Here, we have presented a prioritization system which combines objective ecological information on how species change the state of the invaded environment, with stakeholder assessments evaluating impact categories according to their specific interests and perception of value, to create an overall impact score. Species are thus ranked in importance by combining the overall impact score with an a priori stakeholder rank, according to the perceived importance of stakeholders to the decision maker, who is the ultimate funding body of management measures. The system clearly distinguishes science from values in the decision making process, which is crucial for transparent, rational and sustainable policy making (
By combining stakeholder views and scientific information on species impact, this impact prioritization system can ensure that the outcome of action to manage the most problematic species has little bias from opinions of scientists, or from unintended dominance by any one stakeholder with a loud voice. Ultimately, the decision maker can have some influence on the decision of which species to manage, by deciding which stakeholder group’s opinion is the most important. This weighting of importance should be made in a transparent and repeatable way, for example by using the size of the stakeholder group (assuming that larger groups are of greater importance), but other ways of weighting stakeholder importance might be more appropriate, depending on the situation. However, any ranking of stakeholder importance should be done a priori.
For the system to be used in practice, it needs a few more specifications from the side of the user. For example it needs to be specified how to choose and reach the stakeholders, and according to which criteria and by whom they should be weighted. The system is very flexible and easily adaptable in this respect, as well as in relation to the impact scoring scheme that is used. For these and other possible adaptations and specifications, the system should be tested in practice and it should be documented precisely how the steps were performed and which changes were necessary. Generally, the more a system is used in practice, and the higher the awareness of its shortcomings are, the better and more broadly applicable it can become. A good example for this is the Australian weed risk assessment (WRA), which has been tested worldwide and in different ecosystems, and adapted accordingly (
However, we believe the scheme we have presented here is general enough for different types of decision makers/funding bodies to use at different scales, with minimal modifications required. For instance, relatively local invasive species management projects by conservation organizations may only have a small number of species to assess, with few stakeholders involved. The system could just as easily be used at a regional or national level by government bodies. This process would be facilitated by the lists of problematic IAS that already exist in many countries, e.g. Australia’s ‘Weeds of National Significance’ List (
Another adaptation of the system, should there be a national, multi-species management plan with sufficient funds, would be to split potential species into taxonomic groups (e.g. plants, mammals, birds, invertebrates), or according to habitat/ecosystem (e.g. freshwater or other aquatic habitats, grasslands), which would allow multiple species to be selected for management which are likely to have very different types of impacts in different areas or ecosystems. However, our proposed impact assessment in Appendix A is flexible and broadly applicable enough to allow prioritization for management across a wide range of taxa and ecosystems, if this approach is desired.
Whilst our system can be a useful tool for identifying the highest priority species for management according to society and science, it does not take into account how cost-effective management implementation might be. Ideally, we should try to target those species that are more cost-effective to control or eradicate, at least at local scales. However, the chances of successful control will also depend on other factors than the species itself. Recent studies on the feasibility of eradication found that eradication success mainly depended on the extent of the invaded area (
This framework could potentially be useful for decision makers who need to set priorities for optimal resource allocation. Possible end-users of the framework besides governmental environmental agencies could also be nature conservation organizations (e.g., WWF), or any other organization interested in assessing the impact of IAS. The framework allows the end-user to set priorities for the management of problematic species across a wide range of taxa, by combining the actual change as described in step 2 (scientific input) and impact valuation in step 3 (stakeholders’ valuation of impact categories).
A major strength of the approach highlighted here is the integration of scientific (i.e., objectively measurable) and social (i.e., value-based) assessments of invasive species impacts to prioritize species of concern according to impact severity. In addition, the generic nature of the impact assessment in step 2 and the category valuation by stakeholder makes the system flexible for use on different spatial scales and in different regions.
One potential weakness of the procedure proposed rests at the second step scientific impact assessment. In practice, information on impacts generally has a high uncertainty and often is based only on expert judgements (
Although the framework suggested is primarily meant to prioritize established and invasive species, it could also be used for border control of species which are invasive elsewhere and already known to cause impact, e.g. quarantine species. However, one should be aware of the problems associated with the prediction of future potentially harmful species, and also that this system does not assess entry or establishment probabilities. Particularly early during an invasion, management of species which are still harmless due to their small distributional range but may have a great potential to be detrimental in the future might be more cost-effective than trying to manage widespread species. Understanding how to predict impact is challenging but not impossible, and management decisions have to be made anyway (
In summary, we have presented a framework for prioritising invazive species according to impact severity, which involves the integration of scientifically assessed impacts per species, and socio-economic valuation of general impact importance across stakeholder groups. In theory, this framework could be implemented at multiple spatial scales, and for any group of species considered for management. However, the real value of the framework is revealed only once it has been thoroughly applied and tested, and we encourage the use of this framework to test whether or not it can work in practice as a useful prioritization and decision making tool in invasive species management.
We thank the reviewers for helpful comments on an earlier version of the manuscript, A. Kempel and M. van Kleunen for co-organizing the workshop on “Biological Invasions – Towards general rules across taxa” that initiated this collaboration, and the Inter-University Doctoral Program in Ecology and Evolution, Lausanne for the sponsorship that enabled us to attend.
Definitions of change assessment (impact) scores for IAS. Effects were divided into two main classes with six categories each.
1. Environmental impact
1.1.1 Herbivory/toxicity negative
0 No impact known or detectable.
1 Very low level of herbivory (animals) or toxicity (plants or animals) on at least one native species, no major damage reported.
2 Herbivory or toxicity affecting several native species, without large impact on affected species or decline of their populations.
3 Herbivory or toxicity affecting several native species, at least one native species declining.
4 Herbivory or toxicity affecting many native species, several declining in population size, recorded community change reversible.
5 Herbivory or toxicity affecting native species listed as vulnerable, endangered or critically endangered by IUCN, decline of these species, replacement or even extinction of species, recorded community change irreversible.
1.1.2 Herbivory/toxicity positive
0 No impact known or detectable.
+1 Very low level of herbivory or toxicity affecting at least one species degrading the ecosystem, no impact on performance of affected species recorded.
+2 Herbivory or toxicity affecting one or several species degrading the ecosystem, without large impact on affected species or decline of their populations.
+3 Herbivory or toxicity affecting one or several species degrading the ecosystem, at least one species declining, some/first indications that the ecosystem changes towards its historical functional state.
+4 Herbivory or toxicity affecting one to many species degrading the ecosystem, declining in population size, strong indications that the ecosystem changes towards its historical functional state.
+5 Complete re-establishment of functional state of historical ecosystem that was degraded before invasion of alien species.
1.2.1 Competition negative
0 No impact known or detectable.
1 For animals, very low level of competition with at least one native species, exploitation competition; for plants, low abundance, native species richness not declining.
2 For animals, competition with several native species by exploitation competition, without large impact on affected species or decline of their populations; for plants, moderate abundance, decrease in native species abundance but not richness.
3 For animals, competition with several species, interference competition, at least one native species declining; for plants, high abundance, decrease in native abundance, at least one native species lost.
4 For animals, competition with many native species, several declining in population size, competition for food and/or space, behavioural changes in out-competed species; for plants, high abundance, strong decline in both abundance and richness of native species, native species still able to recruit.
5 For animals, competes with species listed as vulnerable, endangered or critically endangered by IUCN, decline of these species, replacement or even extinction of species; for plants, mono-dominant/near mono-dominant, with no or very few native species remaining; limiting native species recruitment options.
1.2.2 Competition positive
0 No impact known or detectable.
+1 For animals, very low level of competition with at least one native species degrading the ecosystem, exploitation competition, no impact on performance of affected species recorded; for plants, no loss in abundance or richness of native species.
+2 For animals, competition with one or several native species degrading the ecosystem by exploitation competition, without large impact on affected species or decline of their populations; for plants, small increase in abundance of native species, no increase in species richness.
+3 For animals, competition with one or several species degrading the ecosystem, interference competition, at least one species declining, some indications that the ecosystem changes towards its historical functional state; for plants, increase in abundance of native species, small increase in species diversity.
+4 For animals, competition with one to many species degrading the ecosystem, declining in population size, strong indications that the ecosystem changes towards its historical functional state; for plants, increase in abundance of native species and in species diversity.
+5 For animals, completely re-establish functional state of historical ecosystem that was degraded before invasion of alien species; for plants, increase in abundance of native species and in species diversity, including threatened native species.
1.3.1 Predation negative (not relevant for plants)
0 No impact known or detectable.
1 Predation known but negligible, no decline of native species.
2 Predation on several abundant species, without large impact on affected species or decline of their populations.
3 Decline of one to several native species recognized, minor change in food web structure reported.
4 Decline of many species, indirect impact by mesopredator release, clear changes in the food web.
5 Preys also on endemic or species listed as vulnerable, endangered or critically endangered by IUCN, local extinction.
1.3.2 Predation positive (not relevant for plants)
0 No impact known or detectable.
+1 Predation on species degrading the ecosystem known but negligible, no decline of species.
+2 Predation on one or several species degrading the ecosystem, without large impact on affected species or decline of their populations.
+3 Decline of one to several native species degrading the ecosystem recognized, minor change in food web structure reported, some indications that the ecosystem changes towards its historical functional state.
+4 Decline of one to many species degrading the ecosystem, clear changes in the food web, strong indications that the ecosystem changes towards its historical functional state.
+5 Completely re-establish functional state of historical ecosystem that was degraded before invasion of alien species.
1.4.1 Transmission of diseases to wildlife negative
0 No impact known or detectable.
1 Host (plant or animal) for non-specific parasites, occasional transmission of more or less harmless diseases to one native species. No population decline in native species. If a plant, species is not a breeding ground for wildlife disease vectors.
2 Occasional transmission of more or less harmless diseases, several native species affected. No or only minor population decline in native species. If a plant, species may be a breeding ground for wildlife disease vectors, but no more so than native plant species.
3 Many native species affected, frequent transmission of more or less harmless diseases or harmful diseases transmitted to one native species. Minor population decline in native species. If a plant, may be a more significant breeding ground for wildlife disease vectors than native plant species.
4 Transmits harmful diseases to several native species or more or less harmless diseases to endemic or species listed as vulnerable, endangered or critically endangered by IUCN. Moderate population decline in native species. If a plant, a major breeding ground for wildlife disease vectors, outbreaks due to species presence uncertain.
5 Transmits harmful diseases to many species and/or species listed as vulnerable, endangered or critically endangered by IUCN by direct transmission, decline of these species or extinction. If a plant, a major breeding ground for wildlife disease, outbreaks due to species presence certain.
1.4.2 Transmission of diseases to wildlife positive
0 No impact known or detectable.
+1 Occasional transmission of more or less harmless diseases to one species degrading the ecosystem; no population decline in species. Potential positive effect on health of wildlife (direct: e.g. potential medicinal species; indirect: e.g. antagonist of a health threat), but not yet reported.
+2 Occasional transmission of more or less harmless diseases, one or several species degrading the ecosystem affected. No or only minor population decline in species. Occasional, small positive effect on health of wildlife.
+3 One to many species degrading the ecosystem affected, frequent transmission of more or less harmless diseases or harmful diseases transmitted to one species degrading the ecosystem. Minor population decline in species, some indications that the ecosystem changes towards its historical functional state. Regularly small positive effect on health of wildlife, or occasional, larger positive effect on health of wildlife.
+4 Transmits harmful diseases to one to several species degrading the ecosystem. Moderate population decline in species, strong indications that the ecosystem changes towards its historical functional state. Regularly leading to larger positive effect on health of wildlife.
+5 Completely re-establish functional state of historical ecosystem that was degraded before invasion of alien species. Massive positive effect on health of wildlife caused by species.
1.5.1 Hybridization negative
0 No impact known or detectable.
1 Hybridization possible in captivity, but only rarely in the wild.
2 Hybridization is more common in the wild, no offspring, but constraints to normal mating.
3 Hybridization is more common, with offspring, but not fertile.
4 Hybridization common with fertile offspring.
5 Risk of extinction of endangered species.
1.5.2 Hybridization positive
0 No impact known or detectable.
+1 Hybrids are capable of coping with degraded ecosystem process(es), e.g. shown in laboratory experiments, but no indications are found in the field.
+2 Hybrids are able to cope with degraded ecosystem process(es) in the field.
+3 Some/first indications that hybrid changes the ecosystem towards its historical functional state.
+4 Strong indications that hybrid changes the ecosystem towards its historical functional state.
+5 Completely re-establish functional state of historical ecosystem that was degraded before invasion of the hybrid species.
1.6.1 Impact on ecosystem (other than mentioned before, i.e. chemical, physical or structural changes) negative
0 No impact known or detectable.
1 Change in chemical (e.g. eutrophication, nutrient-cycling), physical (e.g. soil compaction, structure, hydrology) and/or structural (e.g. felled trees, burrows, disturbance dynamics) characteristics detectable, but no impact on performance of natives or successional processes.
2 Moderate change in chemical, physical and/or structural characteristics, only slight impact on performance of natives or successional processes.
3 Major change in chemical, physical and/or structural characteristics, change in fauna and flora and/or successional processes, reversible.
4 Severe changes in chemical, physical and/or structural characteristics, decline of species and/or change in species composition, strong impact on successional processes, but likely to be reversible.
5 Massive changes in chemical, physical and/or structural characteristics, endemic species and/or species listed as vulnerable, endangered or critically endangered by IUCN affected, decline of species and/or change in species composition, very strong impact on successional processes, loss of habitat characteristics, damage of sites of conservation importance, irreversible.
1.6.2 Impact on ecosystem positive
0 No impact known or detectable.
+1 Change towards historical state of the ecosystem in chemical (e.g. eutrophication, nutrient-cycling), physical (e.g. soil compaction, structure, hydrology) or structural (e.g. felled trees, burrows, disturbance dynamics) characteristics detectable, but no decline of populations of species responsible for the ecosystem degradation or successional processes.
+2 Moderate change towards historical state of the ecosystem in chemical, physical or structural characteristics, only slight decline of populations of species responsible for the ecosystem degradation or successional processes.
+3 Major change towards historical state of the ecosystem in chemical, physical or structural characteristics, decline of populations of species responsible for the ecosystem degradation, major change towards historical state of the ecosystem in fauna and flora or successional processes.
+4 Severe changes in chemical, physical or structural characteristics, major decline of species responsible for the ecosystem degradation or severe change towards historical state of the ecosystem in species composition or successional processes.
+5 Complete change towards historical state of the ecosystem in chemical, physical or structural characteristics, removal of species responsible for the ecosystem degradation, re-establishment of historical habitat characteristics and successional processes.
2. Socio-economic impact
2.1.1 On agriculture negative
0 No impact known or detectable.
1 Only occasional damage or yield loss to crops or plantations (e.g. orchards), damage similar to native species; for plants, plant present, but no operational obstruction or removal/control cost.
2 Damage or yield loss to crops common, damage or yield loss similar to native species; for plants, little operational obstruction or removal/control cost. Some trade disruptions.
3 Regular damage or yield loss similar to native species through feeding on crops or through competition, occasional threat to stored food, losses exceed impact of the native fauna and flora, sometimes reaching high levels; for plants, operational obstruction and costs to remove/manage invader are still minor. Moderate trade disruptions.
4 Regular high damage or yield loss in fields or to stored food, fruit consumption; for plants, operational obstruction and costs to remove/manage invader are considerable. High trade disruptions.
5 Complete loss of yield or destruction of fields or plantations (e.g. orchards), or of stored food by consumption and contamination; for plants, operational obstruction and costs to remove/manage invader prohibit profitable agriculture on invaded land. Massive trade disruptions.
2.1.2 On agriculture positive
0 No impact known or detectable.
+1 Biological traits and life-style suggest potential positive influence on the yield or quality, but not yet reported.
+2 Occasionally leading to additional yield or increased quality, yield or quality increase small.
+3 Regularly leading to small yield or quality increase or occasionally to larger yield or quality increase.
+4 Regularly leading to larger yield or quality increase.
+5 Massive yield or quality gain caused by species.
2.2.1 On animal production negative
0 No impact known or detectable.
1 Occasional competition with, or loss of yield in livestock or animal production. Plant present but no operational obstruction or removal/control cost.
2 Competition with, or loss of yield in livestock or animal production, transmission of diseases to livestock or production animals in the native area, but not yet reported from the area of introduction. Little operational obstruction or removal/control cost. Some trade disruptions.
3 Competition more frequent with several livestock or production animal species, transmission of diseases reported, but infection rates low. Pollution by droppings on farmland which domestic stock are then reluctant to graze; for plants, loss of yield in livestock or production animals common, operational obstruction or removal/control cost minor. Plant may be toxic to livestock or production animals. Moderate trade disruptions.
4 For animals, transmission of economically important diseases or hybridization with economically important game animals; for plants, loss of yield in livestock or production animals major, operational obstruction or removal/control cost considerable. Plant toxic to livestock or production animals, fatalities uncommon. Large trade disruptions.
5 For animals, transmission of harmful diseases to or hybridization with livestock or production animals; for plants, loss of yield in livestock or production animals major, operational obstruction or removal/control costs are prohibitive. Plant highly toxic to livestock or production animals, fatalities reported. Massive trade disruptions.
2.2.2 On animal production positive
0 No impact known or detectable.
+1 Biological traits and life-style suggest potential positive influence on animal production (e.g. direct: potential livestock or game species, fur production; indirect: e.g. fodder plant, (micro-)organisms increasing yield or quality of fodder plants), but not yet reported.
+2 Occasionally leading to increased production or quality, production increase small.
+3 Regularly leading to small production or quality increase or occasionally to larger production or quality increase.
+4 Regularly leading to larger production or quality increase.
+5 Massive production or quality gain caused by species.
2.3.1 On forestry negative
0 No impact known or detectable.
1 For animals, minor impact through herbivory; for plants, little or no loss of yield or quality or operational obstruction, no change to forest structure or regeneration.
2 For animals, impact through herbivory, minor effect on forest growth, impact on seed dispersal; for plants, minor loss of yield or quality, or operational obstructions, minor changes to forest structure, minor reduction in regeneration. Some trade disruptions.
3 For animals, constrains forest regeneration through browsing on young trees, damage to plantations, gnawing of bark, damage by causing floods; for plants, moderate loss of yield or quality, changes in forest structure, impeded regeneration. Moderate trade disruptions.
4 For animals; moderate to strong damage to mature forest through seed consumption, bark stripping or antler rubbing, death of trees by felling or flooding. Killing trees by defoliating them for nesting material; for plants, strong loss of yield or quality, decline in desired canopy tree species, decline in regeneration potential, major changes to forest structure. Large trade disruptions.
5 For animals; very strong damage to mature forest through seed consumption, bark stripping or antler rubbing, death of trees by felling or flooding; for plants, very strong loss of yield or quality, complete loss or replacement of desired canopy tree species, no regeneration, complete change in forest structure. Massive trade disruptions.
2.3.2 On forestry positive
0 No impact known or detectable.
+1 Biological traits and life-style suggest potential positive influence on forest production (e.g. direct: potential forestry species; indirect: e.g. (micro-)organisms increasing yield or quality of forestry plants), but not yet reported.
+2 Occasionally leading to increased forestry production or quality, compared to native species, production or quality increase small.
+3 Regularly leading to small forestry production or quality increase, compared to native species, or occasionally to larger production or quality increase.
+4 Regularly leading to larger forestry production or quality increase, compared to native species.
+5 Massive forestry production or quality gain, compared to native species, caused by species.
2.4.1 On infrastructure negative
0 No impact known or detectable.
1 Biological traits and life-style suggest potential damage to infrastructure (e.g. potential to increase soil erosion and decrease road stability, physical damage to property and infrastructure, disruption to transport and communications) but not yet reported.
2 Occasional damage with minor economic losses, e.g. damage to fences, impact through pollution, accumulations of droppings, minor increases in soil erosion, localized damage to buildings and ground surfaces from roots and rhizomes (for plants), rare infrastructure problems (clogging up waterways, festooning power lines for plants),
3 Damage to fences and/or plantations, gnawing electricity cables etc., causing road accidents, nesting on current conductions. Moderate increase in soil erosion, moderate damage to property, buildings and infrastructure, frequent obstruction of waterways.
4 Considerable damage to property and infrastructure, with considerable economic costs, damage through burrowing or nesting in buildings, or roots and rhizomes of plants. Major obstruction of waterways.
5 Considerable damage to flood defence systems or other critical infrastructure, major soil erosion, danger to human safety, threat to transport safety.
2.4.2 On infrastructure positive
0 No impact known or detectable.
+1 Have traits or attributes likely to help preserve infrastructure, but not yet reported.
+2 Minor ability to preserve and enhance infrastructure, but performance no better than native or non-plant alternatives. No economic gain.
+3 Moderate ability to preserve and enhance infrastructure (prevent soil erosion), better than non-plant alternative. Marginal economic gain.
+4 Strong ability to preserve and enhance infrastructure better than non-plant alternative, e.g. flood defence and soil preservation, prevention of landslides. Moderate economic gain.
+5 Best option for preserving and enhancing infrastructure, better than non-plant alternative, high economic gain, preserves human safety.
2.5.1 On human health negative
0 No impact known or detectable.
1 Host of one or more harmless diseases with the possibility of infecting humans, not yet reported; for plants, known to be mildly toxic, causing mild discomfort, no cases yet reported.
2 Host of several harmless diseases, indirect transmission or possibility of direct transmission, but only a small percentage of the human population at risk, health hazard from soil and water contamination caused by droppings; for plants, mildly toxic or causing mild discomfort, exposure risk low (not easily ingested, not airborne, direct contact causes no reaction), few cases reported.
3 Direct infection with one or more harmless diseases, occasional health threat through bites or other attacks; for plants, toxic, and/or causing pain, injury or discomfort, exposure risk moderate (poisoning through ingestion, airborne, direct contact causes reaction), moderate number of cases reported.
4 Direct transmission of several diseases, infection by contaminated food common, host of harmful diseases in the native range, but not yet known from the invaded range. Health threat through bites or other injuries happen more often, rarely fatal. Plants highly toxic, and/or causing strong pain/discomfort, but rarely fatal - many cases reported. Exposure risk high, through ingestion, contamination, direct contact, airborne.
5 Vector of harmful diseases to humans and/or many diseases frequently transmitted. Health threat through bites or other injuries happen frequently, more often fatal. Plants highly toxic, causing severe pain and/or discomfort, fatalities reported, or severe disruption to daily life caused through effects on human health. High risk of exposure.
2.5.2 On human health positive
0 No impact known or detectable.
+1 Biological traits and life-style suggest potential positive effect on human health (direct: e.g. potential medicinal species; indirect: e.g. antagonist of a health threat, ameliorating human living conditions), but not yet reported.
+2 Occasional, small positive effect on human health.
+3 Regularly small positive effect on human health, or occasional, larger positive effect on human health.
+4 Regularly leading to larger positive effect on human health.
+5 Massive positive effect on human health caused by species.
2.6.1 On human social life negative
0 No impact known or detectable.
1 Biological traits and life-style suggest potential for disturbance in recreational or residence areas (e.g. by noise, pollution, overgrowing), but nothing yet reported.
2 Occasional small disturbance, only small percentage of human population affected.
3 Regular small disturbance, or occasional larger disturbance.
4 Regular larger disturbance. Recreational value of a habitat or a landscape strongly affected.
5 Massive disturbance; complete loss of recreational value of a habitat or a landscape.
2.6.2 On human social life positive
0 No impact known or detectable.
+1 Biological traits and life-style suggest potential positive effect for recreational or residence areas (e.g. charismatic or decorative species, species ameliorating the environment by providing e.g. shade, or having edible parts, or species potentially used for angling or hunting), but not reported so far.
+2 Occasional small positive effect for recreational or residence areas, only small percentage of human population affected.
+3 Regular small positive effect for recreational or residence areas, or occasional larger positive effect for recreational or residence areas.
+4 Regular larger positive effect for recreational or residence areas. Recreational value of a habitat or a landscape strongly increased.
+5 Massive positive effect for recreational or residence areas. Massive gain of recreational value of a habitat or a landscape.