


(C) 2013 Wayne Dawson. This is an open access article distributed under the terms of the Creative Commons Attribution License 3.0 (CC-BY), which permits unrestricted use, distribution, and reproduction in any medium, provided the original author and source are credited.
For reference, use of the paginated PDF or printed version of this article is recommended.
We aimedto assess the utility of the Global Compendium of Weeds (GCW) as an indicator of plant invasiveness, by relating it to invasiveness at smaller scales. We correlated two global measures of invasiveness for alien plant species taken from the GCW (the total number of references for each species and the number of continental areas they are reported from), against distribution data from 18 regions (countries and continents). To investigate relationships between correlation strength and region size and spatial resolution (size of distribution units), we conducted meta-analyses. Finally, invasiveness measures were correlated against the number of habitats occupied by alien plant species and their median abundance in those habitats, in fine-scale vegetation plots in the Czech Republic and the state of Montana (USA). The majority of Spearman’s rho coefficients between GCW-derived invasiveness and regional distributions were less than 0.4. Correlation strength was positively related to region size and resolution. Correlations were weaker when the number of habitats occupied by a species, and species abundances within occupied habitats, were considered. We suggest that the use of the GCW as an invasiveness measure is most appropriate for hypotheses posed at coarse, large scales. An exhaustive synthesis of existing regional distributions should provide a more accurate index of the global invasiveness of species.
Abundance, alien species distribution, database, exotic plant, global invasiveness, range size
A recent aim in invasion biology has been to synthesise across the accumulated wealth of studies, in order to elucidate any general patterns regarding both causes and consequences of invasions, across species and regions (
Use of the GCW as an indicator of invasion success has not gone without criticism (
Here we assess the adequacy of the GCW in providing a general indication of invasiveness, by analysing the strength of correlation between two measures of invasion success derived from the GCW, and regional distribution data for 18 regions varying both in their size (spatial extent) and spatial resolution (i.e., the grain of the distribution units used). Distributions of native plant species have been shown to be more closely correlated when the size (
We also assess (i) the strength of correlation between GCWinvasiveness measures and the number of habitats species occupied, and (ii) their median abundance in those habitats, derived from fine-scale vegetation-plot data in two regions for which such data are available: the Czech Republic and the state of Montana (USA). At the finest spatial resolution of vegetation plots within habitat types, environmental conditions and exposure to alien plant propagules will be strongly site-dependent. At this scale, the identity and characteristics of individual habitat types may be the most important determinant of invasions (
We obtained regional species-distribution data as regional invasiveness measures, for vascular plants for 18 regions in total, on six continents (Table 1). The regions ranged from countries to whole continents (Table 1). The data were obtained largely from online national databases, floras and published literature (see Table 1). Data for the grid-cell occupancy of species in the Czech Republic were obtained from the working database CzechFlor, held at the Institute of Botany, Academy of Sciences of the Czech Republic, Průhonice. The species included in regional datasets were considered at least to be casual (sensu
The 18 regions included in this study and the data sources for the species distributions per region. Also included is the number of species per region, the region area, the unit of distribution used, and the resolution (area of distribution units, average values given for non-grid cell units).
| Region | Data Source | No. of species | Species included are at least: | Area (km2) | Unit of distribution (number of units) | Resolution (km2) |
|---|---|---|---|---|---|---|
| Argentina |
|
582 | Naturalised | 3, 744, 977 | Province (24) | 162, 825 |
| Australia | AVH Australia Virtual Herbarium (http://chah.gov.au/avh/) Australian Government weeds list (http://www.environment.gov.au/cgi-bin/biodiversity/invasive/weeds/weedspeciesindex.pl?id=701) |
416 | Invasive (‘Weeds’) | 7, 617, 930 | Point record | NA |
| Chile |
|
688 | Naturalised | 757, 725 | Province (50) | 15, 155 |
| China |
|
221 | Invasive | 9, 677, 012 | Province (32) | 224, 621 |
| Europe | DAISIE (http://www.europe-aliens.org/) | 1, 238 | Naturalised | 4, 767, 682 | Country/region (23) | 207, 291 |
| Czech Republic | CzechFlor Database | 918 | Casual | 78, 866 | Grid cell (679) | 132 |
| Germany | FlorKart (http://www.floraweb.de ) | 427 | Casual | 357, 021 | Grid cell (2995) | ca. 130 |
| Great Britain | British and Irish Flora ( |
1, 340 | Casual | 229, 848 | Grid cell (2886) | 100 |
| Ireland | British and Irish Flora ( |
521 | Casual | 84, 421 | Grid cell (1028) | 100 |
| Italy |
|
922 | Naturalised | 301, 338 | Province (21) | 15, 066 |
| North America |
|
3, 682 | Naturalised | 19, 811, 345 | State/Province (66) | 303, 742 |
| Alabama |
|
777 | Naturalised | 135, 765 | County (67) | 1, 962 |
| California |
|
1, 359 | Naturalised | 423, 970 | County (58) | 6, 969 |
| Florida |
|
1, 057 | Naturalised | 170, 304 | County (67) | 2, 080 |
| Montana |
|
534 | Naturalised | 380, 838 | County (56) | 6, 801 |
| New Jersey |
|
683 | Naturalised | 22, 588 | County (21) | 915 |
| Pennsylvania |
|
1, 038 | Naturalised | 119, 283 | County (66) | 1, 764 |
| South Africa | Weeds and Invasive plants database (http://www.agis.agric.za/wip/ ) | 286 | Invasive | 1, 221, 037 | Grid cell (1575) | 775 |
The number of alien species per region varied from 221 (China) to 3, 682 (North America; Table 1). There was no significant correlation between region area and the number of species included (Spearman’s ρ = -0.117, 95% CI = -0.6376, 0.4615, p = 0.644). Region areas were obtained from atlas sources. For regions with non-grid cell distribution units, atlas sources were also used to calculate the mean average area of distribution unit per region, and these values were used as a measure of resolution (Table 1). The largest region was North America (USA + Canada), which also had the coarsest resolution of distribution; the smallest of the 18 regions was New Jersey (Table 1).
Data on the number of habitats/communities and the median abundances of species within those habitats were obtained from vegetation-plot data for the Czech Republic and Montana. Both datasets used originally included native and alien plant species that were present in each plot; however, we excluded the native species for our purposes and included all aliens for Montana and all neophytes for the Czech Republic. The dataset used for the Czech Republic was from
The Global Compendium of Weeds is the most comprehensive list of weedy and invasive species to date (
We used Spearman’s rank correlation to assess the association between regional distribution data and GCW invasiveness measures, because (i) we did not expect relationships to be linear and (ii) data were skewed and sometimes included outliers. Whilst Spearman’s rank correlation is robust to the presence of outliers compared to the product-moment correlation, it can still be affected by heteroscedasticity, and by outliers when they are large in number (
Coefficients and confidence intervals were calculated for correlations between distribution data of each region and one of the two GCW-invasiveness measures: (i) the total number of GCW references, (ii) the number of GCW areas a species was recorded in. This was repeated for (iii) the number of ‘weed only’ category references, and (iv), the number of GCW areas according to ‘weed only’ category references. In all cases, to avoid non-independence of GCW-derived invasiveness and regional distribution measures, references in the GCW from the area containing the target region considered were always excluded (see Table S1 for description of GCW areas). For example, for correlations involving the German and European regional distribution data, all references of species from Europe were excluded in the calculation of the GCW measures. Similarly, for the data from China, all references from East Asia were excluded, as were all references from North America, when Canadian provinces and USA states were analysed.
We used the random effects meta-analysis approach outlined by Gurevitch and Hedges (1999) to analyse the relationship between correlation coefficient strength and region area or resolution. A Pearson’s rank correlation test of area and resolution (both log transformed) revealed that regional areas and resolution were strongly and significantly correlated (Pearson’s R = 0.806, 95% CI = 0.531, 0.927, df = 15, P < 0.0001), and so they were considered individually. Australia was excluded from the analyses involving resolution, as the distribution units for Australia were point records.
First, we transformed Spearman’s rho coefficients (ρ) from the correlations between regional distributions and GCW measures, using Fisher’s Z transformation:
The variance associated with each Z-transformed coefficient was calculated as:
where n equals the sample size. This transformation has the benefit of stabilising the variance of the correlation coefficients, reducing heteroscedasticity. We wanted to analyse these transformed coefficients meta-analytically, and to do so, Gurevitch and Hedges (1999) recommend a random-effects approach, to account for random variation that occurs between effect sizes (transformed coefficients in this study). This requires estimation of not only within-region coefficient variances, but also between-region coefficient variances (Gurevitch and Hedges 1999). To achieve this, we ran a fixed effects linear regression model, with Z-transformed correlation coefficients as the effect sizes, and area or resolution (ln-transformed) as the explanatory variable. The between-region variance in coefficients was then extracted and added to the within-region variances (Gurevitch and Hedges 1999). The inverse of these summed within- and between-region variances was then used as weightings per region in a second linear regression model (the actual meta-analysis). Because of the relatively low sample size (17/18 regions), the second linear regression model was bootstrapped with 999 replicates (where the region coefficients were randomly sampled with replacement), and bias-corrected 95% confidence intervals were inspected to assess the significance of slopes (confidence intervals containing zero indicate that the relationship between correlation strength and region area/resolution is not significantly different from zero). This meta-analytical procedure was conducted for coefficients with each of the GCW-derived invasiveness measures per region.
One potential reason for correlation strength varying between regions could be due to the fact that smaller regions are more likely to have dissimilar, idiosyncratic sets of species compared to the larger regions. To test this, Spearman’s rho correlations were conducted between region size (area) and the proportion of species within a region with zero references from elsewhere outside the target region. A negative correlation with region area would be expected, if smaller regions tend to have more idiosyncratic species not found elsewhere. A bootstrapped, bias-corrected 95% confidence interval (9999 replicates; confidences intervals are hereafter referred to as ‘95% CI’) was used to assess significance of the correlation, as above.
For the vegetation-plot data from the Czech Republic and Montana, the same analytical procedure was used as for the individual regional-scale distribution correlations with GCW invasiveness measures. All analyses were conducted using R 2.14.0 (R Development Core Team 2011).
When all GCW references were considered, the correlation between the number of GCW references and regional distribution measures was significantly different from zero for all regions except Germany (Fig. 1). Spearman’s rho coefficients ranged from 0.091 (Germany) to 0.523 (California). Despite the significance of the correlations, all of them were far from a 1:1 relationship. Only one region (California) had a correlation strength above 0.5 with this GCW invasiveness measure; the majority of regions (13) had correlation coefficients <0.4 (Fig. 1). When the number of GCW areas recording a species was used as the GCW invasiveness measure, the majority of regions (14) had correlation coefficients slightly (but not significantly) lower than when the number of references was used (Fig. 1). When ‘weed only’ category references were considered, the correlations between the number of GCW references or GCW areas and regional distributions were similar in strength overall to those obtained when all references were considered (Fig. S2). Correlation strength was also high (>0.4) for North America and Australia (Fig. 1), which are the two regions most over-represented by references in the GCW, suggesting that the GCW is a reasonable correlate of regional alien plant distribution independently of the reference bias for these two regions. The proportion of species per region with zero references outside the target region was not significantly correlated with region area (ρ=0.170; bootstrapped, bias-corrected 95% CI= -0.4137, 0.6390).
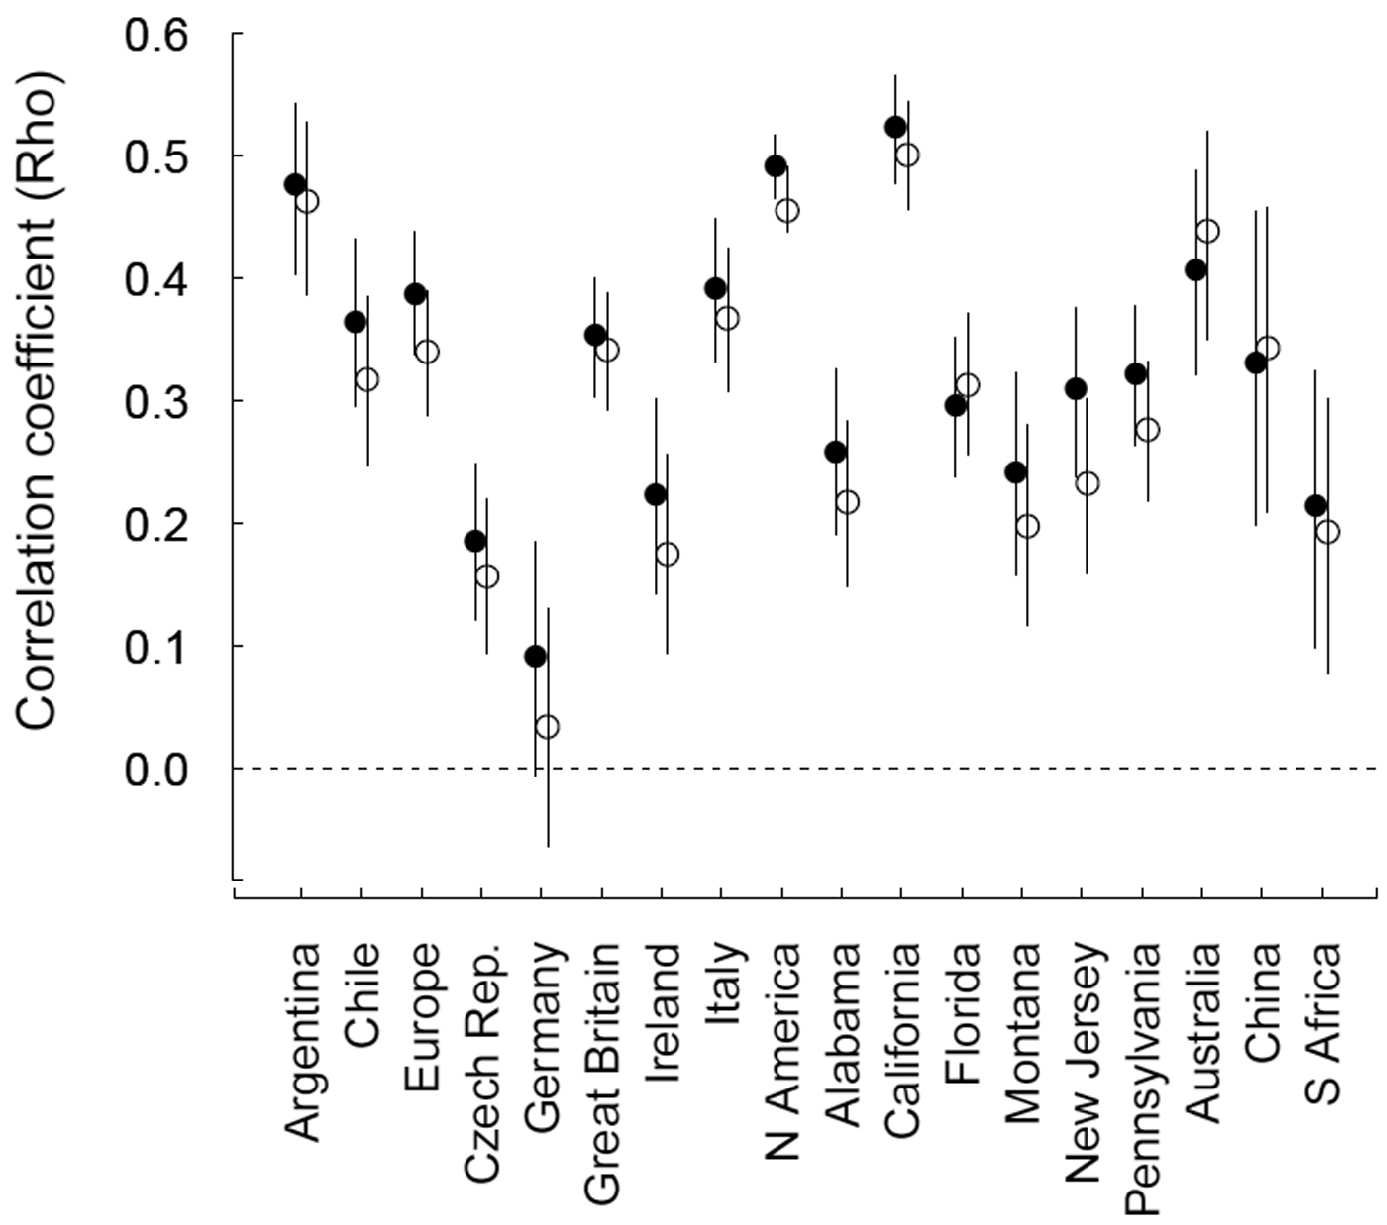
Spearman’s ρ correlation coefficients of the relationship between the number of GCW references (closed circles), or the number of GCW areas occupied (open circles) and the distribution (number of units occupied) of species in 18 regions. GCW measures were calculated using all non-target region references (See Fig. S2 for coefficients using ‘weed-only’ references). Error bars indicate bootstrapped, bias-corrected 95% confidence intervals; the dashed line signifies ρ=0.
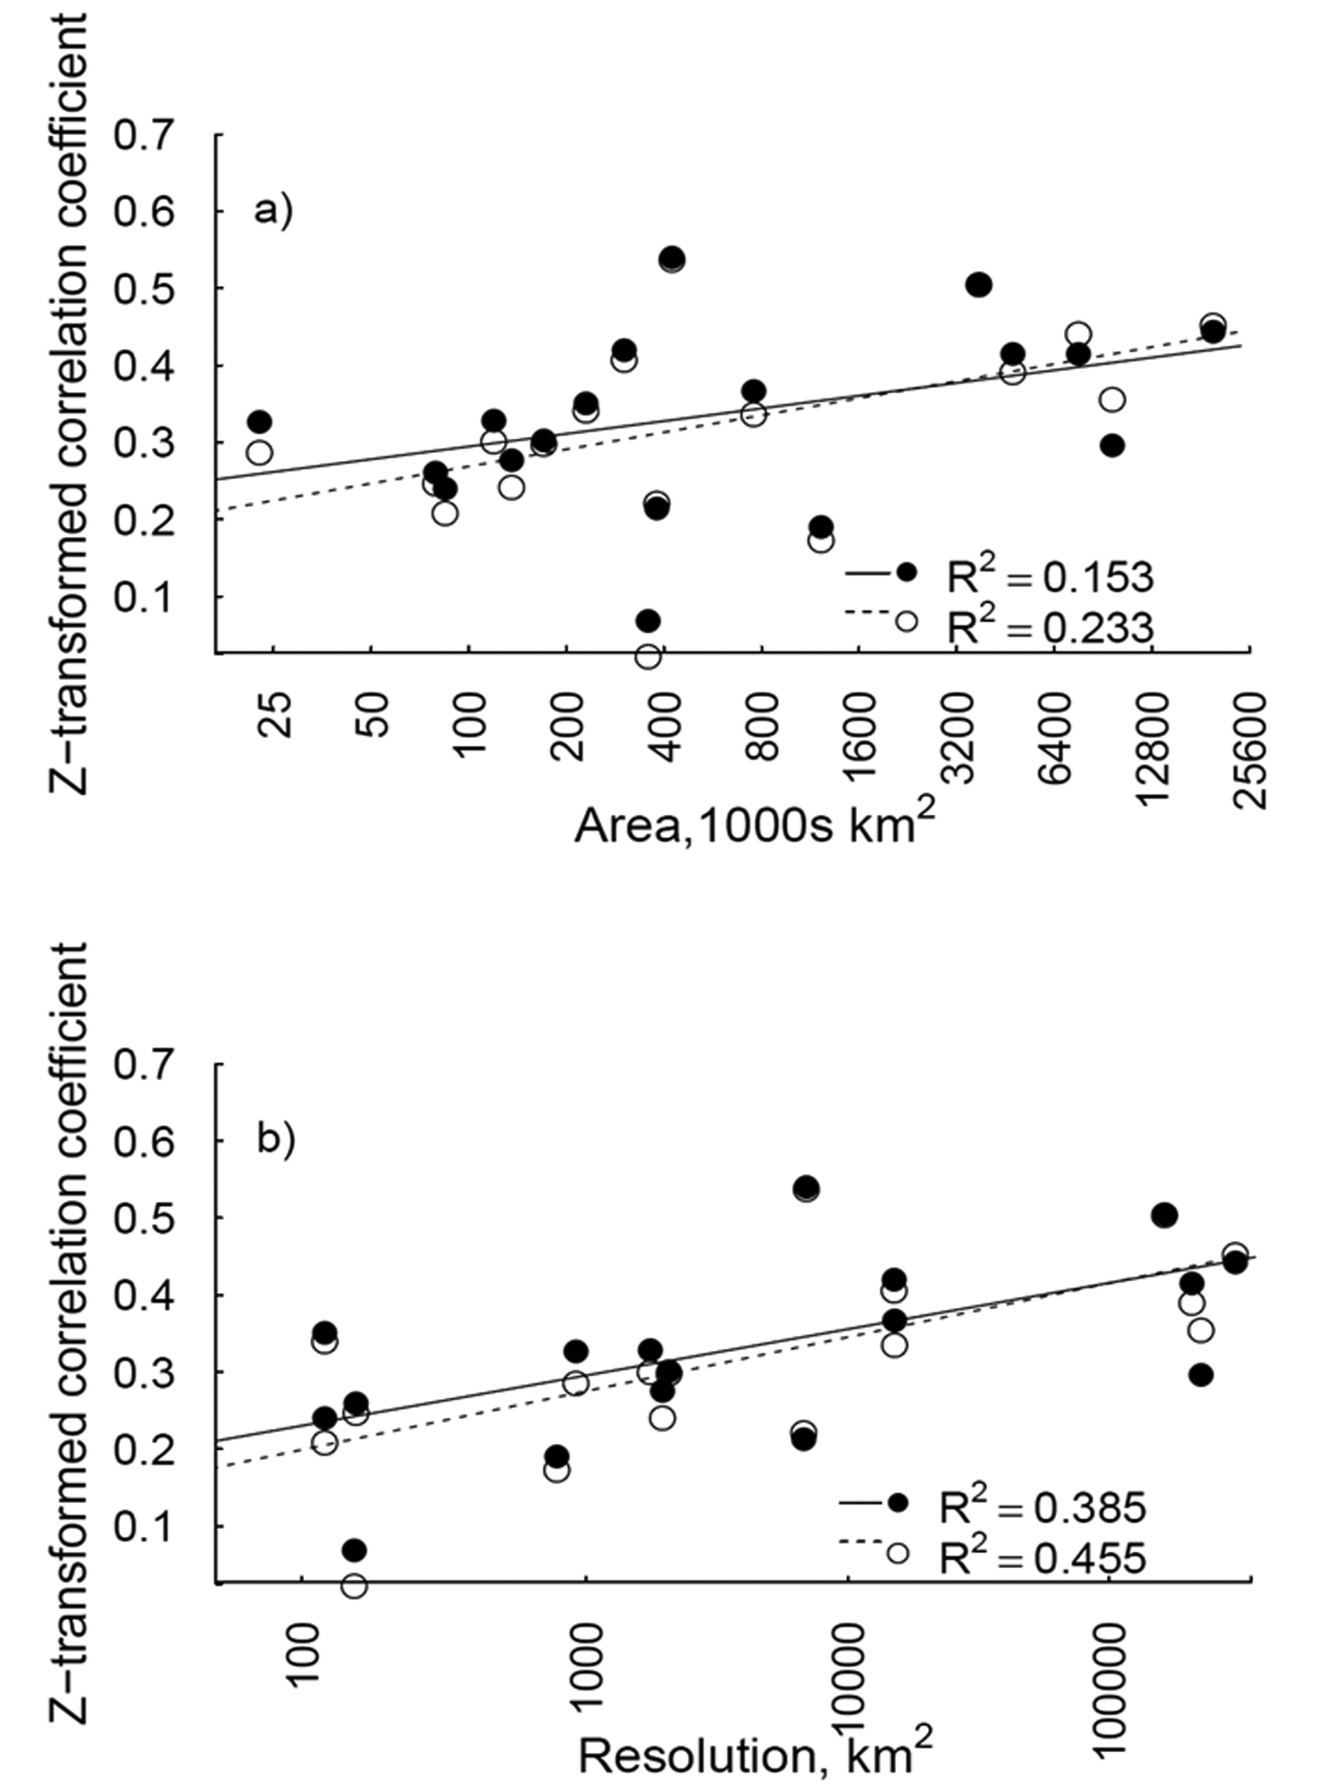
In the meta-analyses, the strength of correlation between GCW-derived invasiveness and regional distributions was significantly and positively related to the area of the target region (Fig. 2a), when the number of references was considered (βln(area)=0.035, 95% CI= 0.012, 0.054). A similar significant, positive relationship with area was observed for the number of GCW areas occupied (βln(area)=0.041, 95% CI= 0.023, 0.059; Fig. 2a).
The strength of correlation between regional distribution and GCW invasiveness was also related to resolution of distribution units; correlation strength increased with increasing average area of distribution units (Fig. 2b). The relationship between resolution and correlation strength was similar whether the number of references (βln(resolution)=0.032, 95% CI= 0.015, 0.048) or the number of GCW areas was used (βln(resolution)=0.033, 95% CI= 0.013, 0.049; Fig. 2b). The relationships between area or resolution and correlation strength were similar when ‘weed only’ references were used, but less variation in coefficient strength was explained by area, than when all references were used (Fig. S3).
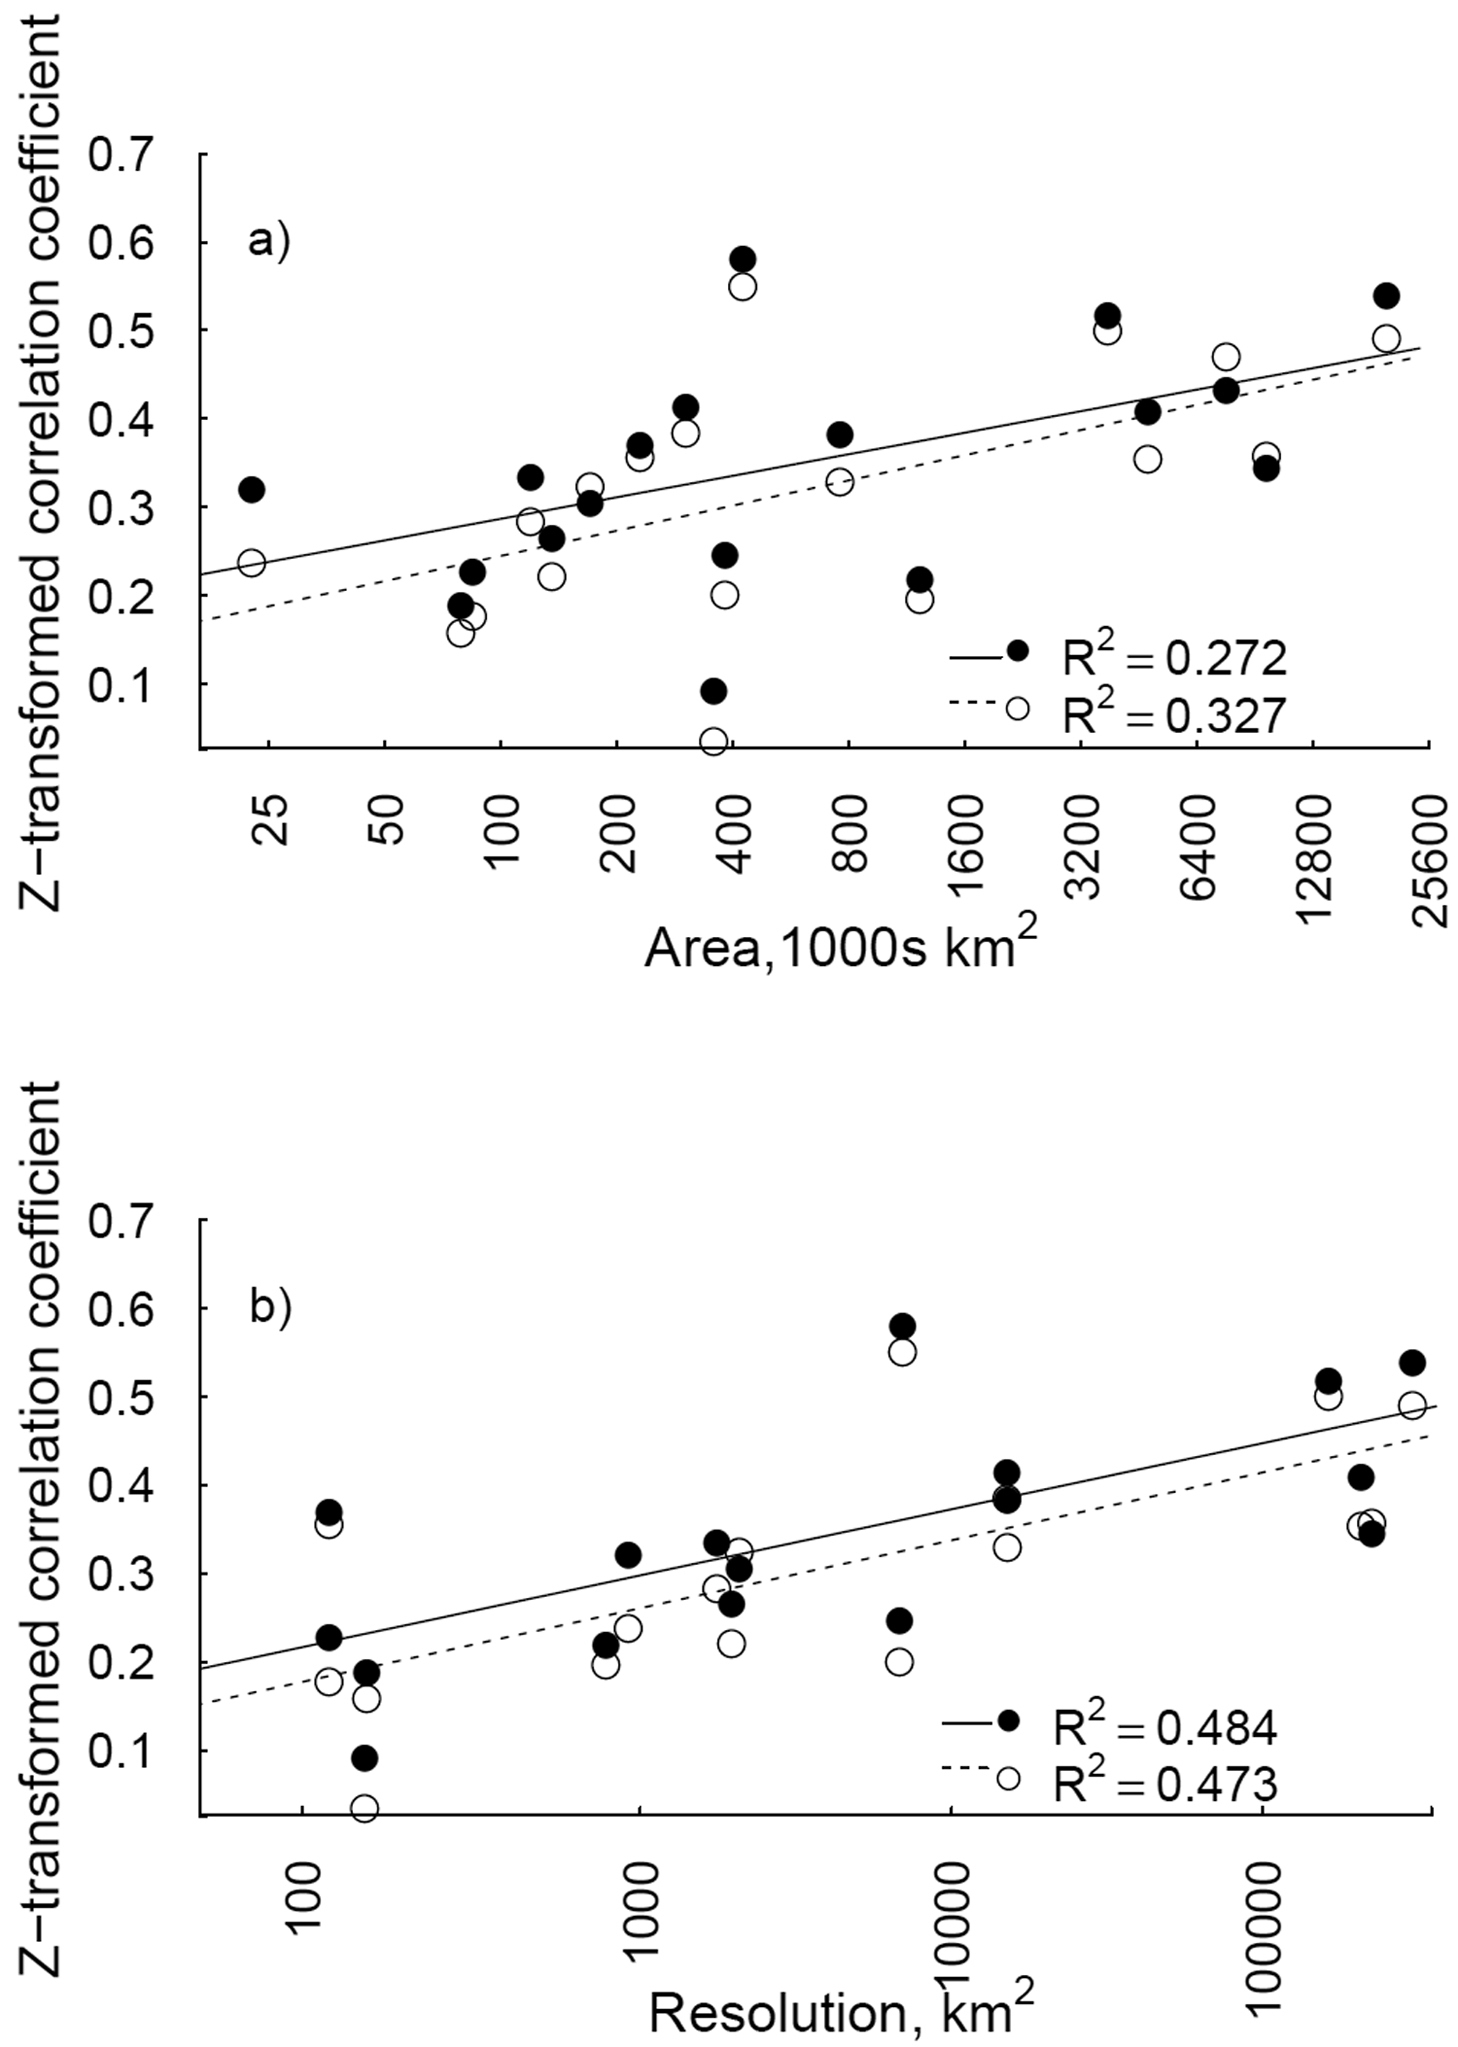
Relationships between the correlation strength (Z-transformed Spearman’s ρ coefficient) of GCW-derived invasiveness measures and regional distributions, and region area (a) and resolution (area of distribution units; b). Solid lines and circles represent the fitted models and correlation strengths per region, respectively, with number of references in the global compendium of weeds as the GCW-invasiveness measure. Dashed lines and open circles are fitted models and region correlation strengths, respectively, with the number of GCW areas as the invasiveness measure. Note the natural log scale on the x axes.
In the Czech Republic, the number of habitats occupied by a species was significantly correlated with GCW invasiveness measures, and the correlation was strongest when number of ‘weed only’ references was used; however, none of the coefficients were >0.3 (Table 2, Table S4). In comparison, correlation strength for the same set of species was always greater (although not significantly) when the number of occupied 11 × 12 km grid cells in the Czech Republic was considered (Table 2). Maximum median cover in a habitat was not significantly correlated with the number of references or the number of GCW areas occupied (Table 2). Results were similar when ‘weed only’ references were used, except average median cover in a habitat for the Czech Republic was significantly and negatively correlated (ρ= -0.15) with the number of GCW areas recording a species (Table S4).
In Montana, the number of plant communities occupied by a species was significantly correlated with the number of GCW references and the number of GCW areas (Table 2). The correlation coefficients for the same set of species were not significant when the number of Montana counties occupied was considered (Table 2). Average median cover in a community was not significantly correlated with the number of GCW references or the number of GCW areas (Table 2). The maximum median cover of species in a habitat for Montana was significantly and positively correlated (ρ= 0.19) with the number of ‘weed only’ references (Table S4).
Spearman’s ρ correlation coefficients (and bootstrapped, bias-corrected 95% confidence intervals) of relationships between GCW-derived invasiveness measures and regional measures of species abundance and distribution from vegetation-plot data in the Czech Republic and Montana. Also given, for comparison, are correlations for the number of Czech Republic grid cells and the number of counties in Montana occupied by a species, using the subset of species occurring in the vegetation plot data for the respective regions. The values in bold are ρ coefficients, that are significantly greater than zero. GCW measures included number of references and the number of global regions according to the Global Compendium of Weeds with all non-target region references included.
| GCW invasiveness | ||
|---|---|---|
| References | Areas | |
| Czech Republic | ||
| Grid-cell data | ||
| Number of 11 km × 12 km squares | 0.382 (0.241, 0.508) | 0.261 (0.111, 0.400) |
| Vegetation plot data | ||
| Number of habitats | 0.282 (0.143, 0.414) | 0.216 (0.070, 0.349) |
| Average median cover per habitat | -0.031 (-0.181, 0.113) | -0.093 (-0.232, 0.053) |
| Maximum median cover in a habitat | 0.072 (-0.080, 0.214) | -0.003 (-0.150, 0.139) |
| Montana | ||
| County data | ||
| Number of counties | 0.168 (-0.023, 0.339) | 0.135 (-0.043, 0.309) |
| Vegetation plot data | ||
| Number of communities | 0.240 (0.057, 0.403) | 0.223 (0.048, 0.384) |
| Average median cover per community | 0.114 (-0.049, 0.270) | 0.083 (-0.080, 0.241) |
| Maximum median cover in a community | 0.160 (-0.006, 0.315) | 0.120 (-0.051, 0.281) |
Synthesis of information on plant invasions and risk assessment schemes across multiple studies and regions could benefit from the development of a globally applicable measure of invasion success. We have shown that the correlations between regional measures of invasiveness and measures derived from the Global Compendium of Weeds (
The weaker correlation between the GCW and fine-scale regional distributions may reflect the incongruence in spatial distribution between scales observed elsewhere for native species (
Many of the regions considered in our study are recipients of largely European plant species (
GCW-derived measures of invasion success were poor correlates of species’ abundance in habitats and communities within which they occur. However, the correlations between habitat breadth and GCW invasiveness measures were significant (Table 2). A relationship between range size and habitat breadth was recently reported for the Czech Republic, where the range of habitats occupied by an alien species increased with larger distribution of the species in this country (
The significant relationship between the number of habitats/communities containing a species and the GCW could potentially be created by a bias toward inclusion of already widespread and established plant species. For example, alien plant species in the Czech vegetation data may not be representative of the entire Czech neophyte flora, as many rare casual aliens will not have been recorded in vegetation plots (
There is a need for a general measure of how invasive alien plant species are across different scales, which will facilitate synthesis of existing and on-going studies in invasion ecology. Whilst a general measure of invasion success based upon the Global Compendium of Weeds may be a good starting point as a correlate of coarse-scale distributions of alien plants in larger regions, it is unable to capture more detailed, fine-scale distributions and species abundances at a local scale. If understanding global-scale patterns of invasiveness remains an important goal in this field, efforts should be made to integrate existing distribution data in a more sophisticated manner than simply compiling lists, using common units of distribution in order to capture how widespread alien plant species are and to allow comparisons among species. In the meantime, we recommend that ecologists use the GCW with caution, as a general indicator of invasiveness limited to larger-scale questions.
PP was supported by grant no. P504/11/1028 (Czech Science Foundation), long-term research development project no. RVO 67985939 (Academy of Sciences of the Czech Republic), institutional resources of Ministry of Education, Youth and Sports of the Czech Republic and acknowledges support by the Praemium Academiae award from the Academy of Sciences of the Czech Republic. NF acknowledges support by Instituto de Ecología y Biodiversidad - IEB (project ICM 05-002; PFB-23) and Fondecyt Postdoc 3120125.
Description of GCW areas used as as measure of invasiveness, based on references in the Global Compendium of Weeds recording a species in a particular global area. The number of references in the Global Compendium of Weeds referring to each global area is listed, along with the countries (or regions) covered.
| Areas | Countries/regions covered | Number of references |
|---|---|---|
| Africa | East Africa, Egypt, Ethiopia, South Africa, Sudan, Tropical Africa, West Africa, Zimbabwe and Zambia | 21 |
| Asia, North and East | Asia (whole), China, Japan, Mongolia, Nepal, Taiwan | 15 |
| Asia, South | Bangladesh, India, Pakistan, Sri Lanka | 4 |
| Asia, South East | Indonesia, Java (Indonesia), Papua New Guinea, South East Asia (whole), Thailand, Vietnam. | 11 |
| Asia, Middle East | Iran and Iraq, Israel, Middle East (whole), Syria | 4 |
| Australasia | Australia, New Zealand | 52 |
| Central America | Central America (whole), Cuba, Guadeloupe, Jamaica, Mexico, Puerto Rico | 10 |
| Europe | Eastern Europe, Europe (whole), Finland, Italy, Mediterranean, Portugal, UK, Western Europe | 14 |
| North America | Canada, North America (whole), USA | 88 |
| Pacific | Galapagos, Hawai’i, Micronesia, Pacific (whole), Pohnpei | 8 |
| South America | Argentina, Brazil, Chile, Guyana, Suriname and French Guiana, Peru, Peru and Ecuador, South America (whole) | 16 |
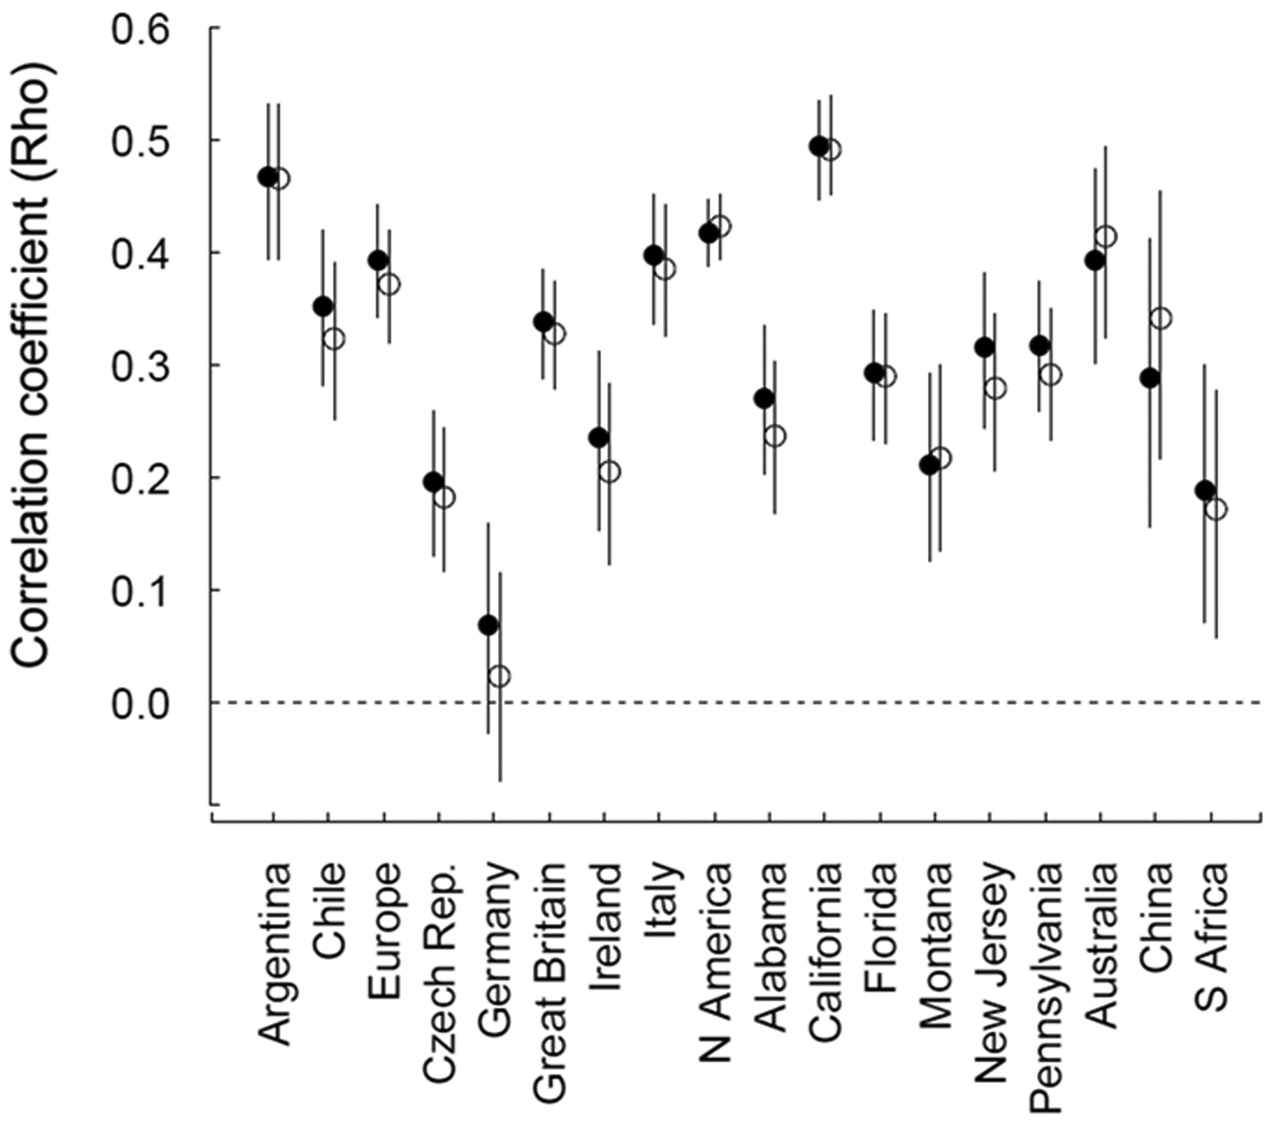
Spearman’s ρ correlation coefficients of the relationship between the number of references in (closed circles), or the number of GCW areas occupied (open circles) according to the Global Compendium of Weeds (using ‘weed only’ references), and the distribution (number of units occupied) of species in 18 regions. GCW-invasiveness measures were calculated using all non-target region references. Error bars indicate bootstrapped, bias-corrected 95% confidence intervals; the dashed line signifies ρ=0.
Relationships between the correlation strength (Z-transformed Spearman’s ρ coefficient) of GCW-derived invasiveness measures (using ‘weed only references in the Global Compendium of Weeds) versus regional distributions, and region area (a) and resolution (area of distribution units; b). Solid lines and circles represent the fitted models and correlation strengths per region, respectively, with number of references in the global compendium of weeds as the GCW-invasiveness measure. Dashed lines and open circles are fitted models and region correlation strengths, respectively, with the number of GCW areas as the invasiveness measure. Note the natural log scale on the x axes.
Spearman’s ρ correlation coefficients (and bootstrapped, bias-corrected 95% confidence intervals) of relationships between GCW-derived invasiveness measures with ‘weed-only’ non-target region references included, and regional measures of species abundance and distribution from vegetation plot data in the Czech Republic and Montana. Values in bold are ρ coefficients significantly greater than zero. GCW measures included number of references and the number of areas occupied according to ‘weed only’ references in the Global Compendium of Weeds.
| ‘Weed only’ references | ||
|---|---|---|
| References | Areas | |
| Czech Republic | ||
| Grid cell data | ||
| Number of 11 km × 12 km squares | 0.416 (0.272, 0.542) | 0.354 (0.204, 0.487) |
| Vegetation plot data | ||
| Number of habitats | 0.300 (0.162, 0.431) | 0.263 (0.117, 0.396) |
| Average median cover per habitat | -0.069 (-0.206, 0.079) | -0.154 (-0.290, -0.005) |
| Maximum median cover in a habitat | 0.050 (-0.095, 0.193) | -0.043 (-0.187, 0.105) |
| Montana | ||
| County data | ||
| Number of counties | 0.108 (-0.072, 0.291) | 0.157 (-0.031, 0.335) |
| Vegetation plot data | ||
| Number of communities | 0.207 (0.022, 0.375) | 0.232 (0.049, 0.397) |
| Average median cover per community | 0.149 (-0.014, 0.304) | 0.094 (-0.064, 0.248) |
| Maximum median cover in a community | 0.189 (0.023, 0.339) | 0.130 (-0.037, 0.285) |