


(C) 2013 Tim M. Blackburn. This is an open access article distributed under the terms of the Creative Commons Attribution License 3.0 (CC-BY), which permits unrestricted use, distribution, and reproduction in any medium, provided the original author and source are credited.
For reference, use of the paginated PDF or printed version of this article is recommended.
Citation: Blackburn TM, Monroe MJ, Lawson B, Cassey P, Ewen JG (2013) Body size changes in passerine birds introduced to New Zealand from the UK. NeoBiota 17: 1–18. doi: 10.3897/neobiota.7.4841
One feature of global geographic variation in avian body sizes is that they are larger on isolated islands than on continental regions. Therefore, this study aims to assess whether there have been changes in body size following successful establishment for seven passerine bird species (blackbird Turdus merula, song thrush Turdus philomelos, house sparrow Passer domesticus, chaffinch Fringilla coelebs, greenfinch Chloris chloris, goldfinch Carduelis carduelis, yellowhammer Emberiza citrinella) introduced from the continental islands of the UK to the more isolated oceanic landmass of New Zealand in the middle of the nineteenth century. Measures of tarsus length were taken from individuals from contemporary UK and New Zealand populations of these species, and from historical specimens collected around the time that individuals were translocated from the UK to New Zealand. Analysis of Variance was used to test for size differences between contemporary UK and New Zealand populations, and between historical UK and contemporary UK and New Zealand populations. Historical UK populations have longer tarsi, on average, than 12 (7 UK and 5 New Zealand) of the 14 contemporary populations. Significant decreases in tarsus length relative to the historical populations have occurred in the UK for blackbird, chaffinch and greenfinch, and in the New Zealand blackbird population. Contemporary New Zealand house sparrows have significantly longer tarsi, on average, than both historical and contemporary UK populations. Exposure to novel environments may be expected to lead to changes in the morphology and other traits of exotic species, but changes have also occurred in the native range. In fact, contrary to expectations, the most common differences we found were between contemporary and historical UK populations. Consideration of contemporary populations alone would underestimate the true scale of morphological change in these species over time, which may be due to phenotypic plasticity or genetic adaptation to environmental changes experienced by all populations in the last 150 years.
Body size, Exotic species, Historical population, New Zealand, Passerine Bird, Tarsus length
The traits possessed by species are not fixed, but change in response to a variety of selective forces. The rate of evolution is typically slow (
In the second half of the nineteenth century, European colonists introduced more than 100 exotic bird species to the isolated archipelago of New Zealand, as part of organized attempts to naturalise a range of useful and ornamental species there (
Several studies provide evidence that reproductive life history traits differ between exotic New Zealand populations and native populations of the same bird species in their location of origin. For example, hatching failure rates tend to be higher in New Zealand than in native populations, in inverse proportion to the number of individuals introduced, suggesting an effect of the population bottleneck on this reproductive trait via increased levels of inbreeding (
While there is evidence for changes in reproductive traits, to date no study has tested for differences in body size in the native and New Zealand exotic ranges of bird species. Yet, body size is a fundamental characteristic, which tends to correlate strongly with other aspects of a species’ life history (
First, one of the primary features of global geographic variation in avian body sizes is that they are on average larger on islands relative to continental regions, and larger at higher latitudes (
Second, the largest members of bird genera are likely to be island taxa more often than expected by chance (
Third, several case studies of recent natural or human-mediated avian colonizations of islands identify differences in body size associated with colonization. For example,
Here, we test for changes in body size between native and exotic populations for seven species of passerine bird introduced from the UK to New Zealand in the middle of the nineteenth century (
We compared contemporary New Zealand (2003 – 2005; N = 140), contemporary UK (2005 – 2011; N = 175) and historical UK (1848 – 1879; N = 126) specimens of blackbird (Turdus merula), song thrush (Turdus philomelos), house sparrow (Passer domesticus), chaffinch (Fringilla coelebs), greenfinch (Chloris chloris), goldfinch (Carduelis carduelis) and yellowhammer (Emberiza citrinella). These species were chosen because specimens were available to us from all three populations of interest. Eight historical specimens of goldfinch (all from 1946), two of greenfinch (both from 1892) and one each of song thrush (1901 and house sparrow (1891) from New Zealand were also available for comparison, although the low sample sizes meant that we only formally analysed these data for goldfinch. These goldfinch specimens date from midway between the date of introduction of this species to New Zealand and the contemporary New Zealand samples, but we may nevertheless predict some change between 1946 and the present. The historical UK specimens bracket the dates of first introduction to New Zealand of all these species (Table 1).
The contemporary New Zealand specimens sampled were all live birds caught opportunistically as part of fieldwork by John Ewen (J.E.) in New Zealand, spanning latitudes from Hauturu to Palmerston North (see
Sample sizes of tarsus measurements included in the analysis for each population, together with the date of first known introduction into New Zealand from the UK.
| UK | New Zealand | ||||
|---|---|---|---|---|---|
| Species | Historical | Contemporary | Historical | Contemporary | Date |
| Blackbird | 18 | 16 | 16 | 1862 | |
| Song thrush | 8 | 14 | 15 | 1865 | |
| House sparrow | 25 | 30 | 39 | 1862 | |
| Chaffinch | 27 | 33 | 4 | 1862 | |
| Greenfinch | 16 | 28 | 10 | 1862 | |
| Goldfinch | 11 | 21 | 8 | 4 | 1862 |
| Yellowhammer | 21 | 6 | 23 | 1862 | |
We used tarsus length as our measure of body size. This is a measure of size that is invariant across seasons and is available for measurement on all the specimens available to us – most other standard aseasonal size measures, such as beak dimensions, wing chord and tail length, were not available on the post-mortemed GBHi specimens. Tarsus length was measured as full tarsus using dial Vernier callipers. Measurements were taken twice, with high repeatability: intraclass correlations (
All specimens were measured by J.E. except for the contemporary house sparrow specimens from the GBHi, for which we used measurements taken by either Becki Lawson (B.L.; N = 28) or Katie Colvile (K.C.; N = 5) during the post-mortem examination. We tested for differences in the measurements made by J.E., B.L. and K.C. using paired t-tests to compare tarsus lengths taken from 25 GBHi specimens from 9 different bird species.
For all species except the song thrush, we analysed only birds that had been aged as adult. Birds were classed as juveniles until the post-juvenile body moult was complete. First year birds beyond their post-juvenile moult and adult birds were not differentiated. The tarsus is in any case fully grown at fledging and does not change thereafter, so we do not expect mis-aging of specimens to affect the results. The relative paucity of certain adults in the song thrush samples meant that we combined data from birds of all ages, and tests across all populations confirmed that there was no difference in tarsus length between adults, first years or birds of unknown age (ANOVA: F2, 35 = 0.115, P = 0.89). We also excluded birds of unknown sex for all species except song thrush and goldfinch, for which many specimens could not be unambiguously identified as male or female.
We analysed models of tarsus length that included sex (male/female, or male/female/unknown), population (contemporary New Zealand, contemporary UK, historical UK; and for goldfinch, historical New Zealand), and their interaction, as factors. All analyses were carried out using ANOVA in R v. 2.14.1 (
Means and variances of tarsus lengths for each population of each species are given in Table 2. Full models for tarsus length as a function of population, sex, and their interaction, are given in Table 3 for all species. Sex was a significant predictor of tarsus length only for chaffinch, while the interaction between sex and location was significant only for yellowhammer. Population was a significant predictor of tarsus length for all species except song thrush and goldfinch. Figure 1 shows the median and variation in tarsus length across the various populations for each species, with sexes plotted separately for chaffinch and yellowhammer.
Mean and variance (mm) of tarsus length for each population of each species. % quantifies the change in each contemporary population relative to the UK historical mean, and equals 100 x (contemporary mean/UK historical mean). No measurements are available for historical New Zealand populations of blackbird, chaffinch and yellowhammer, and only single measurements for song thrush and house sparrow. Sample sizes are as in Table 1. The largest population mean for each species is given in bold, and the smallest in italics.
| UK | New Zealand | |||||
|---|---|---|---|---|---|---|
| Species | Historical | Contemporary | % | Historical | Contemporary | % |
| Blackbird | 39.43 ± 1.66 | 38.27 ± 0.87 | 97.1 | 38.40 ± 0.99 | 97.3 | |
| Song thrush | 37.22 ± 1.97 | 37.10 ± 0.85 | 99.6 | 36.25 ± 1.33 | 97.3 | |
| House sparrow | 22.34 ± 1.39 | 21.72 ± 0.96 | 97.2 | 23.07 ± 0.26 | 103.3 | |
| Chaffinch | 21.93 ± 0.71 | 20.73 ± 0.42 | 94.5 | 21.51 ± 0.55 | 98.1 | |
| Greenfinch | 21.72 ± 1.11 | 21.02 ± 0.40 | 96.8 | 21.33 ± 0.33 | 98.2 | |
| Goldfinch | 17.72 ± 0.92 | 17.12 ± 0.22 | 96.6 | 17.81 ± 3.14 | 17.56 ± 0.25 | 99.1 |
| Yellowhammer | 22.80 ± 0.40 | 21.93 ± 0.64 | 96.2 | 22.92 ± 0.68 | 100.5 | |
Results of ANOVA with tarsus length (mm) as the response variable and population, sex and their interaction, as predictor variables. d.f. = degrees of freedom for the comparison.
| Population | Sex | Interaction | ||||
|---|---|---|---|---|---|---|
| F | d.f. | F | d.f. | F | d.f. | |
| Blackbird | 7.82 |
2, 59 | 1.24 | 1, 59 | 0.69 | 2, 59 |
| Song thrush | 1.67 | 2, 30 | 1.73 | 2, 30 | 0.31 | 2, 30 |
| House sparrow | 20.05 |
2, 88 | 0.03 | 1, 88 | 1.59 | 2, 88 |
| Chaffinch | 17.12 |
2, 58 | 11.21 |
1, 58 | 0.50 | 2, 58 |
| Greenfinch | 4.04 |
2, 48 | 0.83 | 1, 48 | 0.98 | 2, 48 |
| Goldfinch | 1.19 | 3, 32 | 1.90 | 2, 32 | 0.42 | 6, 32 |
| Yellowhammer | 4.46 |
2, 44 | 0.83 | 1, 44 | 3.25 |
2, 44 |
* P < 0.05
**P < 0.01
***P < 0.001
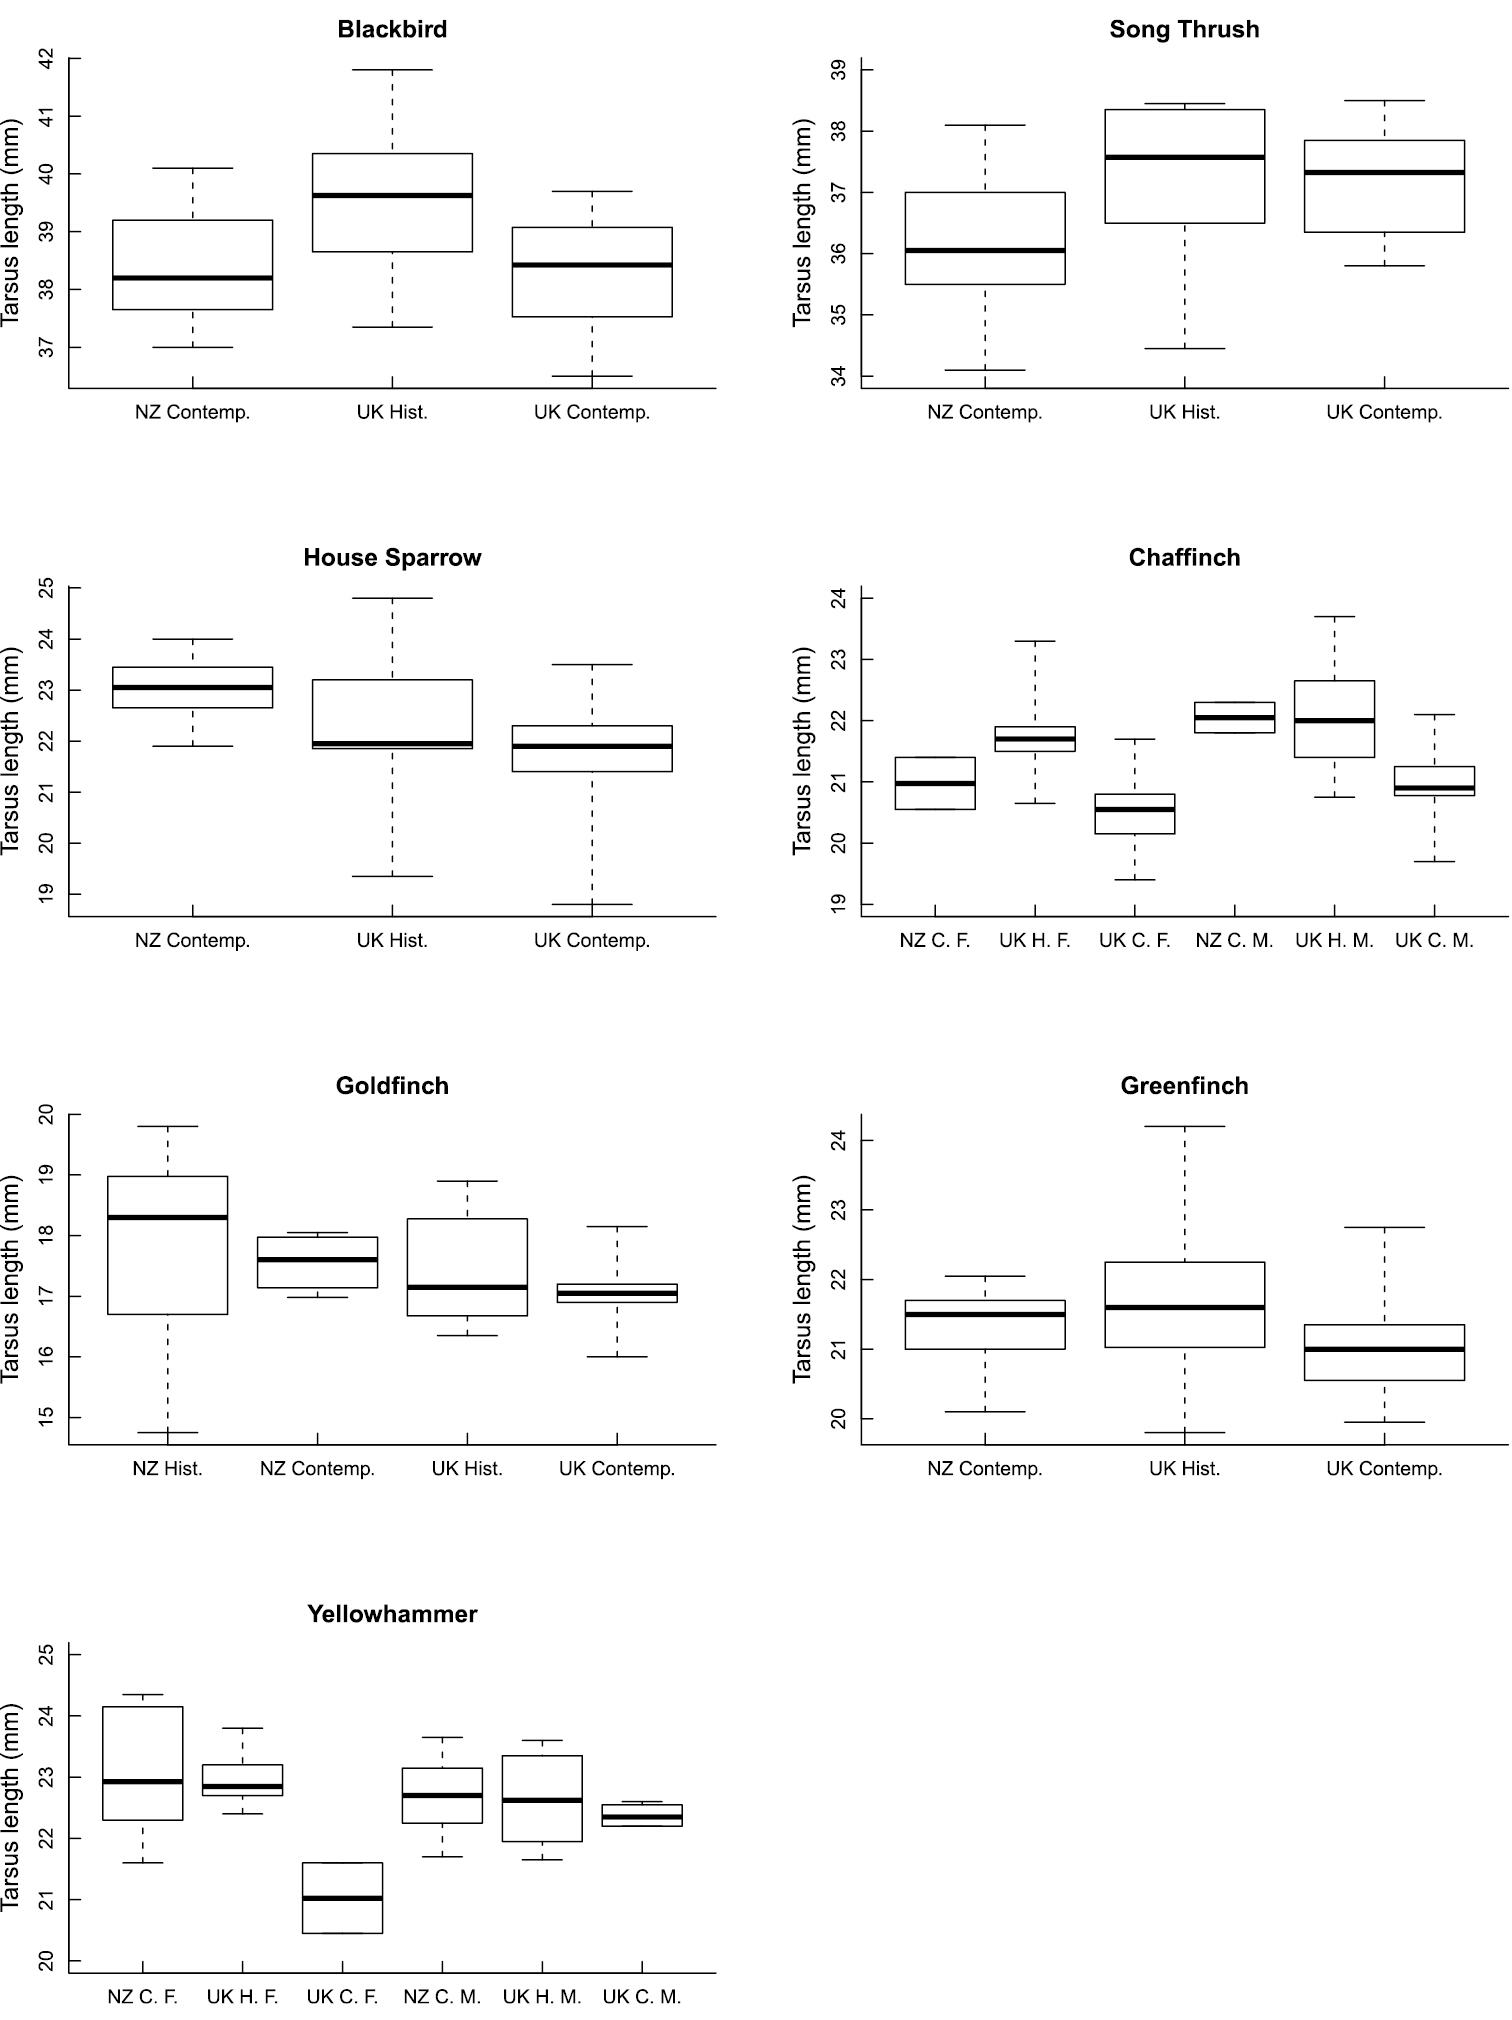
Box plots showing the median (dark line), quartiles (box), and range (whiskers) in tarsus length across the various populations for each species. Sexes are plotted separately for chaffinch and yellowhammer, as the models in Table 3 suggest sex differences for these species. NZ = New Zealand; Contemp. and C = contemporary; Hist. and H = historical; F = female; M = male.
Contemporary UK populations have the shortest mean tarsus length for every species except the song thrush, for which the contemporary New Zealand populations are the smallest (Table 2). Birds from historical UK populations have the longest tarsus lengths for blackbird, song thrush, greenfinch, and chaffinch. Birds from contemporary New Zealand populations have the longest tarsus lengths for house sparrow and yellowhammer, while the longest goldfinch tarsi, on average, are possessed by historical New Zealand birds (Table 2). Contemporary means vary between 94.5% (UK chaffinch) and 103.3% (New Zealand house sparrow) of the UK historical means for the species (Table 2). The average change in tarsus length between historical and contemporary means is 2.56%. The maximum absolute change in mean tarsus length is 1.2mm for the UK population of the chaffinch. This equates to a change of around 0.009 mm yr-1 given that the mean sample year was 1871 for historical specimens and 2006 for contemporary specimens, or –416 Darwins.
Post-hoc comparisons on the models plotted in Figure 1 reveal no significant differences between any of the populations for song thrush or goldfinch. For blackbird, birds from the historical UK population have longer tarsi than both contemporary UK (difference ± 95% confidence interval = 1.16 ± 0.91 mm, P = 0.009) and contemporary New Zealand (difference = 1.03 ± 0.91 mm, P = 0.023) birds. For house sparrow, birds from the contemporary New Zealand population have longer tarsi than both contemporary UK (difference = 1.34 ± 0.51 mm, P < 0.001) and historical UK (difference = 0.73 ± 0.54 mm, P = 0.005) birds. For greenfinch, birds from the historical UK population have longer tarsi than contemporary UK birds (difference = 0.69 ± 0.59 mm, P = 0.018). The same is true for chaffinch for both male (difference = 1.09 ± 0.75 mm, P < 0.001) and female (difference = 1.18 ± 0.88 mm, P = 0.002) birds. For yellowhammers, contemporary UK females are smaller than females from other populations, but the small sample size for this group (N = 2 females) and their unusually small tarsus lengths relative to all other groups (Figure 1) suggest that these results should not be over-interpreted. Significant differences have relatively high statistical power (mean sample size for significant comparisons = 47.2, mean for non-significant comparisons = 30.6; F1, 12 = 5.37, P = 0.039), but significant results do also have larger size changes than non-significant results (mean absolute percentage change = 3.52% vs 2.02%; F1, 12 = 4.94, P = 0.046), suggesting that power is not the only driver of significance.
Comparison of measurements obtained by the three different measurers from common specimens showed no significant differences in the measurements obtained by J.E. and K.C. (t = -1.68, N = 25, P = 0.11). However, estimates obtained by B.L. tended to be larger than those obtained by both J.E. (t = 5.47, N = 25, P < 0.001) and K.C. (t = 4.68, N = 25, P < 0.001).
Increasing numbers of studies are providing evidence for morphological differences between introduced exotic and native source populations of species, for taxa as diverse as plants (e.g.
In the 150 years or so since the seven species in our analysis were introduced from the UK to New Zealand, population mean tarsus lengths have changed by between 0.4 and 5.5%, with an average absolute change of 2.56%. Absolute changes have been greater in the UK populations, averaging 3.14% versus 1.97% in the New Zealand populations. The direction of change has been negative in 12 of the 14 populations, including in all seven UK populations. Contemporary UK populations have the shortest tarsi, on average, for six of the seven species measured. Significant decreases in tarsus length have occurred in the UK populations of blackbird, chaffinch and greenfinch, and in the New Zealand blackbird population. Our a priori expectation was for size increases in the New Zealand populations relative to the historical UK populations, but the only change that fitted this expectation, and indeed the only significant increase in size relative to the historical UK population, was for the house sparrow. The rate of change for the largest difference in these data, for the UK population of the chaffinch, is equivalent to –416 Darwins. This is larger than 89% of the rates of morphological change estimated by
Previous studies that have tested for morphological differences only between contemporary exotic and native populations may also fail to identify instances where morphological changes have occurred over time, if parallel changes occur in both populations. An example is provided in our data by the blackbird. Here, the contemporary UK and New Zealand populations do not differ significantly in tarsus length, but both contemporary populations have significantly shorter tarsi than the historical source population from the UK. Comparison of the contemporary populations would lead to the erroneous conclusion that no morphological change had occurred in the exotic population after introduction. It follows that the absence of any morphological difference between contemporary exotic and native populations does not necessarily mean that no changes have occurred in these populations over the period since the exotic population was introduced. One should not forget that native populations can change too, particularly in response to current human-induced environmental change.
A range of previous studies on body size in island birds led us to predict that species might increase in size following introduction to New Zealand. Islands tend to be home to the largest members of bird genera (
First, tarsus length may not be a suitable measure of body size change in these populations, either because it does not adequately measure body size, or because it is not the relevant aspect of size. In respect to the adequacy of tarsus as a measure of size,
Second, the time available since introduction to New Zealand may have been inadequate for the species concerned to have produced the predicted size changes. This seems unlikely. On the one hand, more than 100 generations have been available for size changes to occur in these species, if selection pressure for larger size exists. This has been enough time to produce geographic clines in body size in several exotic species in New Zealand (e.g.
Third, there may in fact be no differences in the novel New Zealand versus the native UK environments that would lead to larger size in the former. This might seem unlikely, as there is evidence from native species that birds do attain larger size on New Zealand (
Fourth, those features of the environment that drove size increases in the native New Zealand avifauna may still apply, but may be being offset by new conditions. An obvious candidate is climate change. Official UK Department of Energy and Climate Change figures show that annual average temperatures in central England have increased by around 0.8–0.9°C in the period since bird species were introduced to New Zealand (http://www.decc.gov.uk/en/content/cms/statistics/climate_stats/data/data.aspx), with a similar increase in New Zealand over the last 100 years (http://www.climatechange.govt.nz/science). There is substantial global geographic variation in avian body sizes related to temperature, with species living at high latitudes and in cooler climates (and on islands) being generally larger-bodied than their relatives living at lower latitudes or in warmer climates (
Climate is not the only aspect of the environment to have changed over the last 150 years. Agricultural intensification in the UK has led to farm landscapes with fewer areas of non-crop, and lower densities of weeds and insects (
Finally, the possibility that the differences between populations can be dismissed as methodological biases also needs to be considered. The first point to note here is that the small sample sizes available for some populations mean that observed differences – or lack thereof – should not be over-interpreted. Small sample sizes give less power to detect significant differences if they exist. This suggests if anything that the conclusions we base on our results are likely to be conservative, and yet we still found significant changes in tarsus length in most species. Small sample sizes will only be problematic for our conclusions if they are also biased. However, measurements of tarsus lengths for British populations of these species in the literature show a significant difference between sexes only for chaffinch (
We can also exclude the possibility that differences between populations arise from effects of different measurers. All specimens were measured by J.E., except for the contemporary house sparrow carcasses, which were mainly measured by B.L. Comparisons between measurers showed that B.L. tended to produce longer tarsus measurements than J.E., yet contemporary UK house sparrow tarsi were shorter, on average, than both the contemporary New Zealand and historical UK tarsi measured by J.E.. The effect of different measurers for house sparrow populations means that the observed difference between contemporary UK and New Zealand populations of this species are likely to be conservative, and suggest also that the reduction in size between historical and contemporary UK populations is likely to be greater than that recorded in Table 2.
Differences between populations could, however, be the result of the different types of specimens measured – live birds versus defrosted carcasses versus dried skins. Drying of specimens can in some cases change tarsus length measurements, albeit that drying does not change tarsus lengths of all species in the same direction (c.f.
Differences between populations could also be a consequence of differences in where individuals were sampled, as there is geographic variation in body size across geographic ranges within bird species (
In conclusion, comparison of tarsus lengths in contemporary native UK and exotic New Zealand populations of seven passerine bird species reveals a significant difference in only one species, the house sparrow. However, consideration of contemporary populations alone masks the fact that significant changes in tarsus length have occurred over the last 150 years in five populations of four species, and therefore underestimates the true scale of morphological change in these populations over time. UK populations of blackbird, chaffinch and greenfinch, and the New Zealand population of the blackbird have all significantly decreased in size, while house sparrows in New Zealand have significantly increased. Why these particular populations should show significant changes in size over the last 150 years, while others show no changes, is unclear. There are no obvious features of location, species, life history, or gross ecology that relate to this variation. Thus, it remains of considerable interest to explain why some populations have changed in morphological size (tarsus length), but not others (assuming that there is more than simply idiosyncratic or stochastic change occurring), and in addition, whether these changes are the result of phenotypic plasticity or genetic adaptation.
We thank Mark Lomolino, Shai Meiri, Virginie Millien and Ally Phillimore for comments that greatly improved an earlier version of this manuscript, Shinto John for helping with access to the GBHi carcasses, Katie Colvile for assistance with measuring contemporary house sparrow specimens, Robert Prys-Jones and other staff at the Natural History Museum, Tring, for access to historical specimens, and the King Saud University Distinguished Scientist Fellowship Programme for funding assistance. The GBHi received financial support from the Universities Federation for Animal Welfare, the RSPB, Defra, CJ Wildbird Foods, Gardman Ltd., Cranswick Pet Products, Tom Chambers Ltd., the Birdcare Standards Association and the BVA Animal Welfare Foundation. We thank the members of the public and participants in the British Trust for Ornithology’s Garden BirdWatch who submitted carcasses to the GBHi for post mortem examination. P.C. is an ARC Future Fellow (FT0991420).