


(C) 2013 Robert C. Venette. This is an open access article distributed under the terms of the Creative Commons Attribution License 3.0 (CC-BY), which permits unrestricted use, distribution, and reproduction in any medium, provided the original author and source are credited.
For reference, use of the paginated PDF or printed version of this article is recommended.
Citation: Venette RC (2013) Incorporating climate change into pest risk models for forest pathogens: a role for cold stress in an era of global warming? In: Kriticos DJ, Venette RC (Eds) Advancing risk assessment models to address climate change, economics and uncertainty. NeoBiota 18: 131–150. doi: 10.3897/neobiota.18.4047
Climate change may alter the distribution and activity of native and alien pathogens that infect trees and, in severe cases, cause tree death. In this study, potential future changes in climate suitability are investigated for three forest pathogens that occur in western North America: the native Arceuthobium tsugense subsp tsugense, hemlock dwarf mistletoe, and two alien invasive species, Dothistroma septosporum, the cause of red band needle blight or Dothistroma needle blight, and Phytophthora ramorum, the cause of sudden oak death or ramorum blight. Specifically, the software CLIMEX is used to calculate Cold-Stress, Heat-Stress, and Dry-Stress indices for each pathogen in 98, 224 grid cells in North America. Downscaled climate projections from the general circulation models CGCM1, CSIROMk2, and HadCM3 drive forecasts for 2020, 2050 and 2080. These climate projections are then analyzed to forecast shifts in the geographic extent of abiotic stresses that are severe enough to directly kill pathogen propagules and prevent year-round establishment of these pathogens. Cold stress currently has a major impact on climate suitability for all three pathogens; heat stress is likely to become more significant in the future. I forecast that the geographic extent of cold stress will decline from its current levels by a constant 5% (± 1%) of all grid cells in each 30-yr projection horizon for all three pathogens. Forecasts suggest the extent of heat stress will increase concurrently by 4% (± 1%) in each 30-yr projection horizon. Drought stress shows no consistent trend over time. No disproportionate effect of climate change on the two alien invasive pathogens over the native is forecasted. These results suggest that forecasts of future climate suitability for pathogens based on historical climate normals are accurate for less than 30 yrs. Adaptive management strategies in forestry will be needed to respond as these changes unfold.
Sudden oak death, red band needle blight, hemlock dwarf mistletoe, CLIMEX, alien invasive pathogens, exotic species
Trees play pivotal roles in global carbon cycles. They remove significant amounts of carbon from the atmosphere annually and sequester fixed carbon for long periods (
Climate change portends significant shifts in the structure and function of forests. In particular, ecological niche models for a number of tree species suggest future areas of climatic suitability will shift polewards in response to changes in temperature and moisture (
Though climate change may be the ultimate cause of tree death, the proximate cause may be the activity of insects and diseases (
A general concern about the interaction of climate change and invasive alien species continues to grow (
Pest risk maps illustrate how the likelihood and consequence of invasion by an alien species varies spatially within an area of concern (
A number of analysts have incorporated climate change into forecasts of future climate suitability for invasive alien species (e.g.
The purpose of this study was to compare the potential effects of future climate change on population stresses experienced by three forest pathogens: Arceuthobium tsugense (Rosendahl) G.N. Jones subsp tsugense, western hemlock dwarf mistletoe, hereafter simply Arceuthobium tsugense; Dothistroma septosporum (Dorog.) Morelet, the cause of Dothistroma (or red band) needle blight; and Phytophthora ramorum Werres, de Cock & Manin’t Veld, the cause of sudden oak death and ramorum blight. Phytophthora ramorum is an oomycete that can infect more than 100 plant species and is new to Europe and western North America (
Climate data. Climate normals and output from general circulation models downscaled to 10 arc-minutes were obtained from Worldclim.org, specifically mean monthly minimum temperature, maximum temperature, and precipitation. Downscaling had been performed using ANUSPLIN (
I restricted my analysis to North America, the only continent on which all three pathogens co-occur. Within the climate data sets, I functionally defined North America as those grid cells with centers occurring within the box with a northwest corner at 170°W and 80°N and a southeast corner at 50°W and 12°N. Individual grid cells were excluded from the analysis if projected minimum temperature was greater than the maximum temperature or if some climate data were missing. This standard ensured that exactly the same areas of North America were compared over time and left 98, 224 grid cells for the continent. Data files were processed to be compatible with CLIMEX ver 2.0 (Hearne Scientific Software, South Yarra, Australia).
Estimation of abiotic stresses acting on pathogens. The “Compare Locations” feature of CLIMEX ver 2.0 was used to forecast physiological stresses experienced by Arceuthobium tsugense, Dothistroma septosporum, and Phytophthora ramorum in response to extreme cold, heat, drought, and wetness now and in the future. CLIMEX calculated values for respective stress indices when temperatures or moistures exceeded species-specific thresholds. Stress also accumulated at species-specific rates. The final Cold-Stress, Heat-Stress, Dry-Stress, and Wet-Stress indices potentially varied from 0 to 999. Values of 0 indicated no stress, and values of 100 indicated complete inoculum mortality from an abiotic agent. Values greater than 100 reflected severely stressful conditions (
CLIMEX parameters for each species are reported in Table 1. CLIMEX parameters for Phytophthora ramorum were taken from
CLIMEX stress parameters for three forest pathogens.
| Index | Parameter | Arceuthobium tsugense | Dothistroma septosporum | Phytophthora ramorum |
|---|---|---|---|---|
| Cold stress | TTCS=temperature threshold (°C) | -3.9 | -30 | - |
| THCS=stress accumulation rate (wk-1) | -0.025 | -0.05 | - | |
| DTCS=degree-day threshold | - | - | 15 | |
| DHCS=stress accumulation rate (wk-1) | - | - | -0.0001 | |
| Heat stress | TTHS=temperature threshold (°C) | 22 | 29.9 | 30 |
| THHS=stress accumulation rate (wk-1) | 0.001 | 0.247 | 0.005 | |
| Dry stress | SMDS=moisture threshold |
0.3 | 0.10 | 0.2 |
| HDS=stress accumulation rate (wk-1) | -0.015 | -0.005 | -0.005 | |
| Wet stress | SMWS=moisture threshold |
2.5 | - | 2.5 |
| HWS=stress accumulation rate (wk-1) | 0.002 | - | 0.002 | |
| Hot-wet stress | TTHW=temperature threshold (°C) | - | 28°C | - |
| MTHW=moisture threshold |
- | 1 | - | |
| PHW=stress accumulation rate (wk-1) | - | 0.025 | - |
† Moisture is expressed as a proportion of moisture holding capacity with values of 1 equal to saturation. Values > 1 reflect flooded conditions.
CLIMEX parameters for Dothistroma septosporum were obtained from
Statistical analyses. All statistical analysis was performed in SAS 9.2 (SAS Institute, Cary, NC). Although individual grid cells are the observational units in this study, each observational unit is not independent in space. Thus, analyses focused on the proportions of grid cells in North America in which CLIMEX indices of cold stress, heat stress, wet stress or drought stress were >99. A grid cell that met one of these criteria was projected to be inhospitable for the year-round presence of the pathogen. The emphasis on grid cells with stress >99 ignores cases in which an abiotic agent might cause partial mortality of the population, but allows the analysis to focus on clear potential shifts in the geographic range in which a pathogen might be forecast to persist year-round. I refer to these proportions as the extent of stress. – Wet stress in North America was always 0 for each of the pathogens under the current and future climate, so wet stress was not analyzed statistically.
The extent of each stress from 2020 to 2080 was found to be normally distributed (Univariate procedure in SAS 9.2) and was analyzed first with repeated measures analysis of variance (Mixed procedure in SAS 9.2). General circulation model (n=3) and year (n=3) were included as main effects with a first-order auto regressive term to account for temporal covariance in the data. The experimental design did not allow for the testing of an interaction between year and general circulation model. Differences among forecasts for 2020, 2050, and 2080 were estimated using Tukey’s multiple comparison test of least-squares means with α = 0.05. Two-tailed t-tests for the difference between a population mean and a hypothesized population mean to compare results from 2020, 2050, and 2080, the population means, with results for the current climate, the hypothesized population mean, because no statistical sources of variation existed for stress estimates based on current climate. A Bonferroni-adjustment of α was applied to correct for multiple comparisons and ensure an overall α = 0.05.
To compare changes in the extent of each stress over time among pathogens, I used mixed model analysis for linear regression (Mixed procedure in SAS 9.2). A first-order autoregressive error structure was used to account for autocorrelation in observations over time. Factors in the regression were general circulation model (n=4, now including current), pathogen (n=3), and time (n=4). Time was measured in 30-yr projection horizons, with 0 corresponding to 1990, 1 corresponding to 2020, and so on. All observations from the same levels of each general circulation model and pathogen effectively represent a single subject. The analysis assumes independence of observations from different subjects. Degrees of freedom were determined using the Kenward-Rogers approach. Paired contrasts were used to test for different intercepts and slopes among regression lines for each pathogen. A Bonferroni-adjustment of α was applied to correct for multiple comparisons and ensure an overall α = 0.05.
All maps were created in ArcMap 9.3 (ESRI, Redlands, CA). For each stress index at each projection horizon, a grid cell is assigned the median stress value forecasted from the three general circulation models.
Effects of climate change on stress projections for each pathogen. CLIMEX models driven by downscaled output from general circulation models suggest the geographic extent of cold stress for Arceuthobium tsugense will diminish in time (df = 2, 4; F=24.52; P=0.006) while the extent of heat stress will increase (df = 2, 4; F=103.22; P<0.001). The extent of drought stress is projected to be greater than it is currently, but no different from 2020 through 2080 (df = 2, 4; F=1.13; P=0.408). Approximately 78.7% of grid cells are currently too cold for Arceuthobium tsugense to persist (Fig. 1A). These cells generally fall north of 37°N latitude but not along the East or West Coasts (Fig. 2). The extent of cold stress will be reduced by 2020 (Fig. 1A), then generally occurring north of 39°N latitude, remain relatively unchanged through 2050 and again decline by 2080, when cold stress will generally occur north of 40°N latitude (Fig. 2). Heat stress currently affects 23.2% of grid cells (Fig. 1A), generally south of 42°N latitude (Fig. 2). This stress will increase to 30.6% in 2020 (Fig. 1A), generally south of 43°N latitude (Fig. 2), and continue to increase by an average of 3% of all grid cells in each subsequent 30-yr projection horizon through 2080 (Fig. 1A), by which time heat stress is projected to be severe throughout most of Mexico and the contiguous United States (Fig. 2). Drought stress for Arceuthobium tsugense currently affects 47.9% of all grid cells in North America, generally west of 96° W longitude (Fig. 2). This extent will increase to approximately 50.3% by 2020 and remain at this level through 2080 (Fig. 1A).
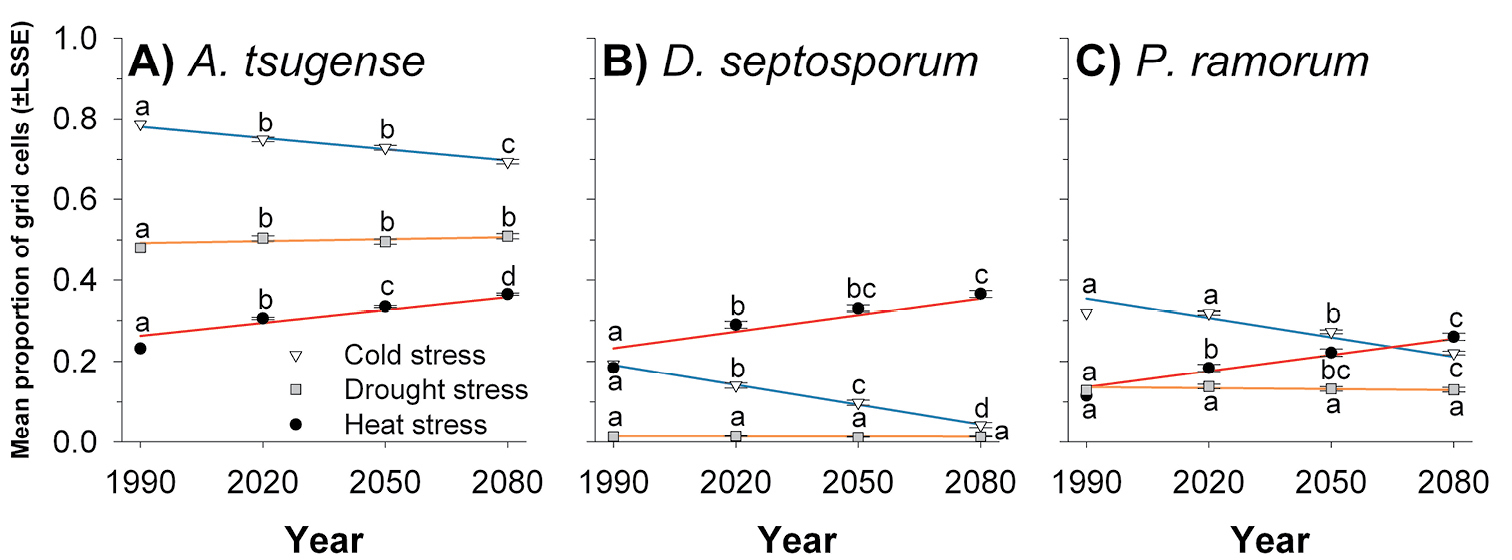
Proportion of North American grid cells with CLIMEX stress indices >99 over time for A Arceuthobium tsugense B Dothistroma septosporum and C Phytophthora ramorum. For each species, values for a stress with the same letter are not significantly different at α = 0.05. Lines are predicted values from regression models described in Table 3. LSSE, least-squares standard error.
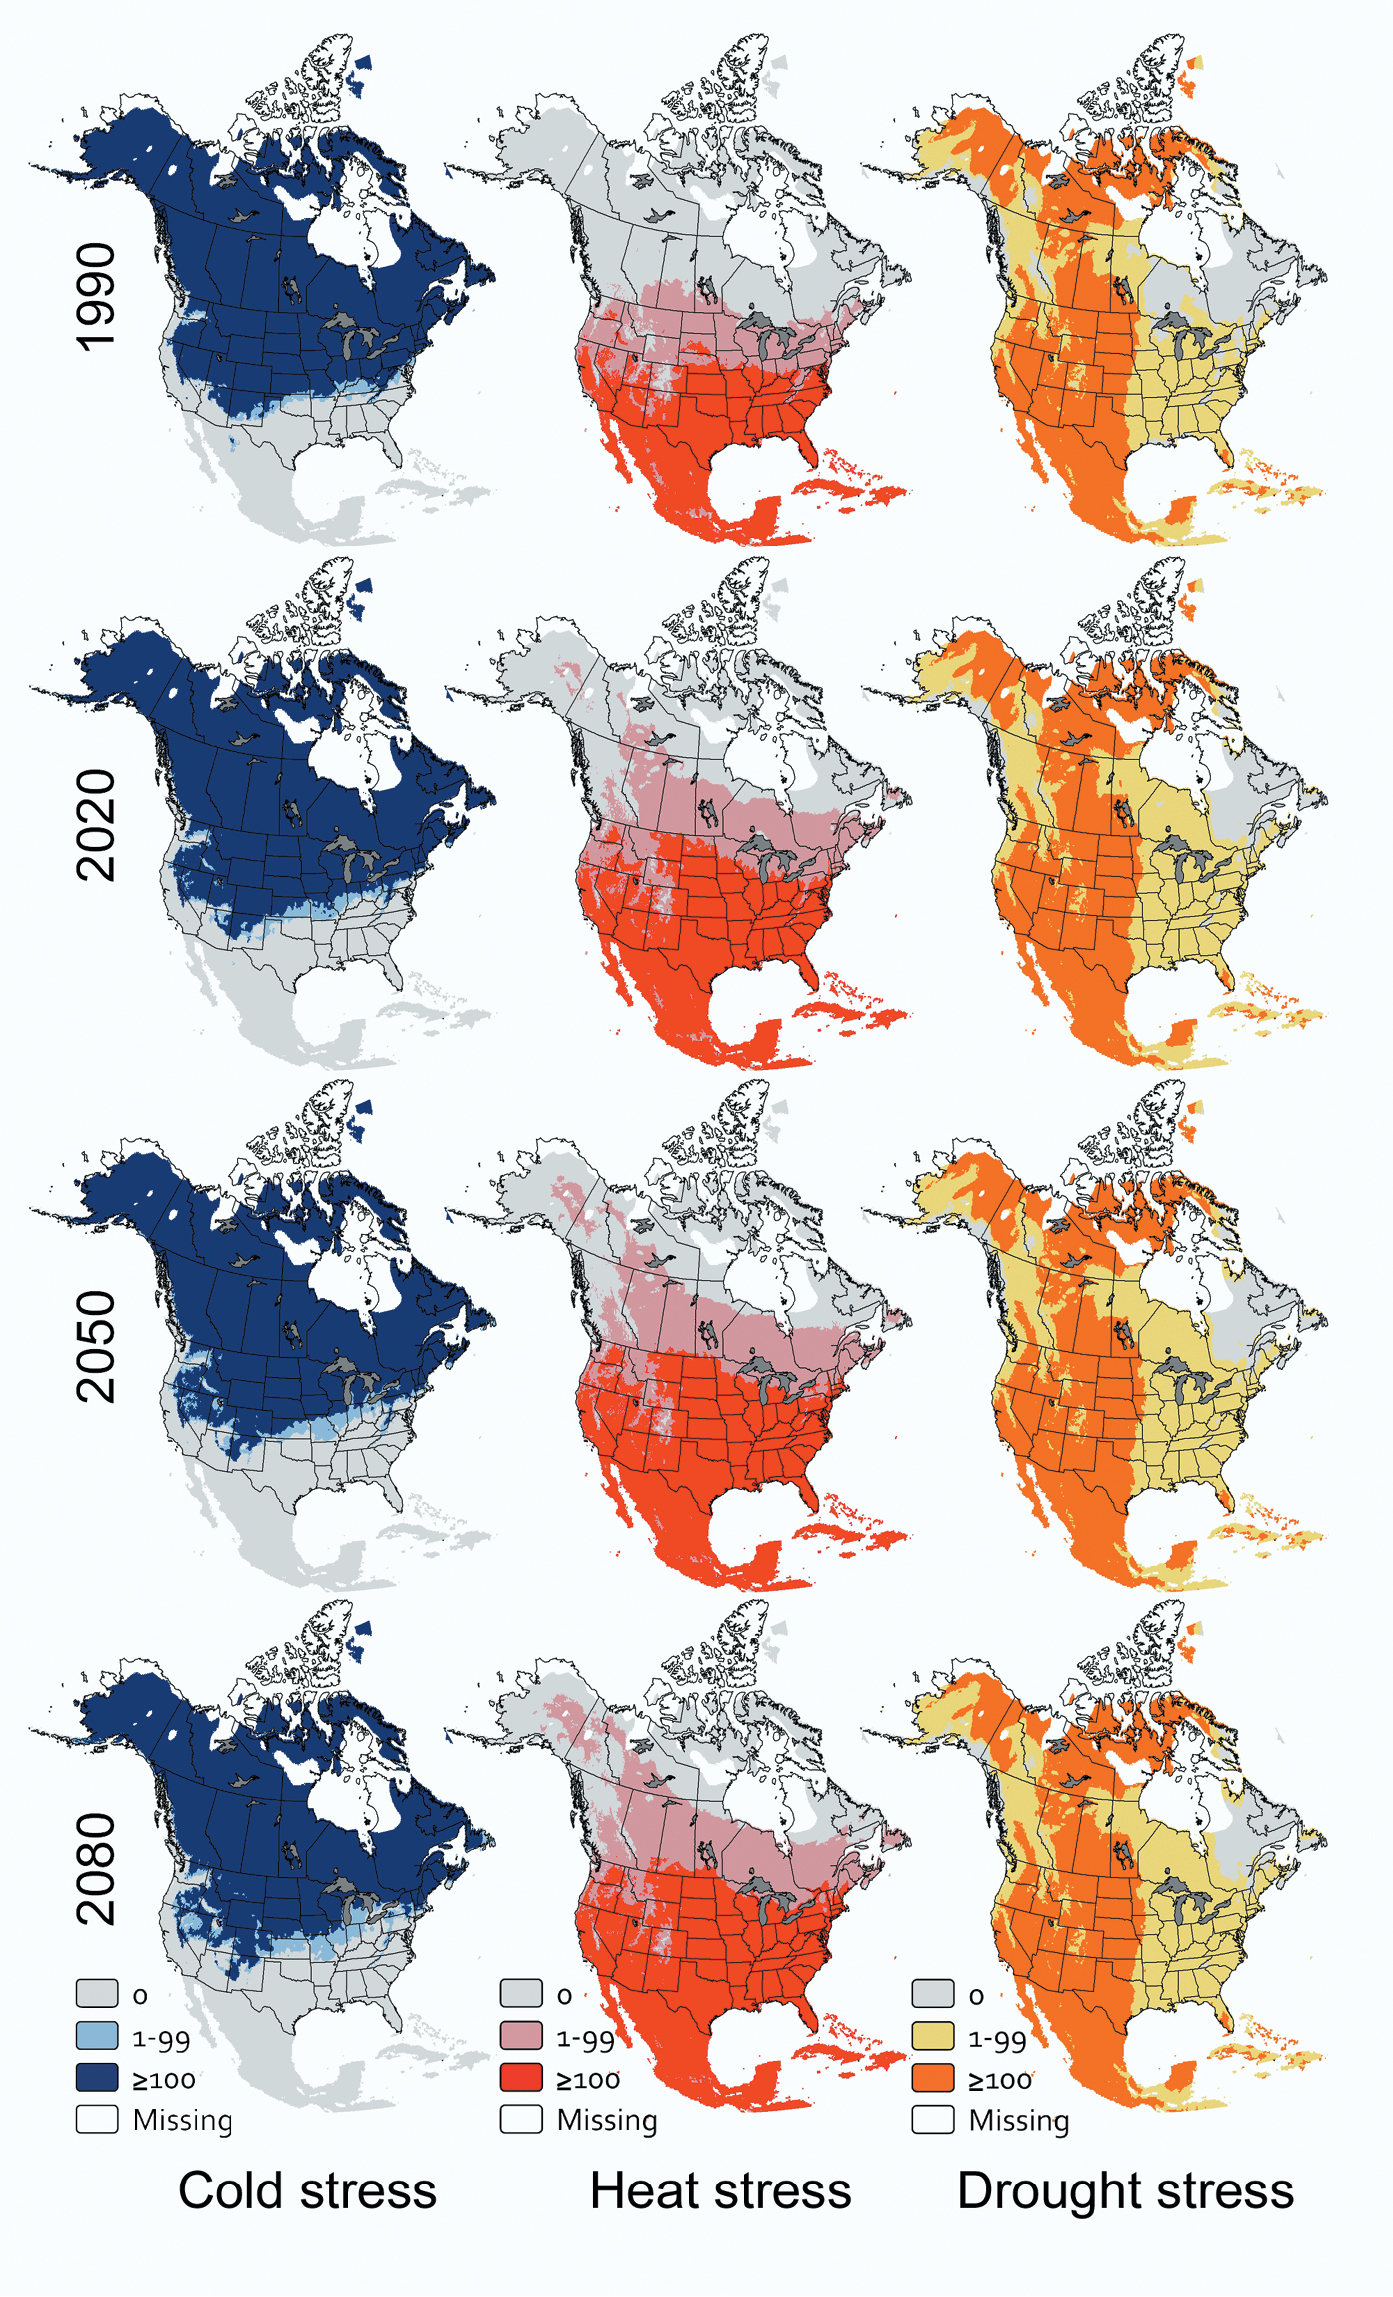
CLIMEX stress indices over time for Arceuthobium tsugense in North America.
For Dothistroma septosporum, the future extent of cold stress in North America will diminish through time (df = 2, 4; F=59.12; P=0.001) while the future extent of heat stress will increase (df = 2, 4; F=19.35; P=0.009); forecasts suggest the extent of drought stress for this pathogen will not change (df = 2, 4; F=1.75; P=0.284). Currently, 19.3% of grid cells are inhospitable to Dothistroma septosporum because of cold, greater than in any future 30-year projection horizon for this pathogen (Fig. 1B). These cells generally occur north of 62°N latitude (Fig. 3). In each subsequent projection horizon, about 5.0% of all grid cells will lose cold stress, so by 2080, only 4.2% of grid cells will be too cold for Dothistroma septosporum to remain viable year-round (Fig. 1B). These cells are projected to occur in northern Canada and Alaska (Fig. 3). Heat stress currently affects 18.4% of grid cells, less than in any future projection horizon (Fig. 1B), grid cells with a Heat Stress index > 99 occur generally south of 37°N latitude (Fig. 3). The proportion of grid cells with heat stress will increase to 29.0% by 2020 and by an additional 3.8% of all grid cells in each subsequent projection horizon through 2080. By this time heat stress will extend throughout Mexico and the contiguous United States, except at high elevations and along the Pacific coast (Fig. 3). Drought stress is expected to affect approximately 1.3% of all grid cells now and through 2080, primarily in Baja California, Mexico and the desert Southwest, USA (Fig. 3).
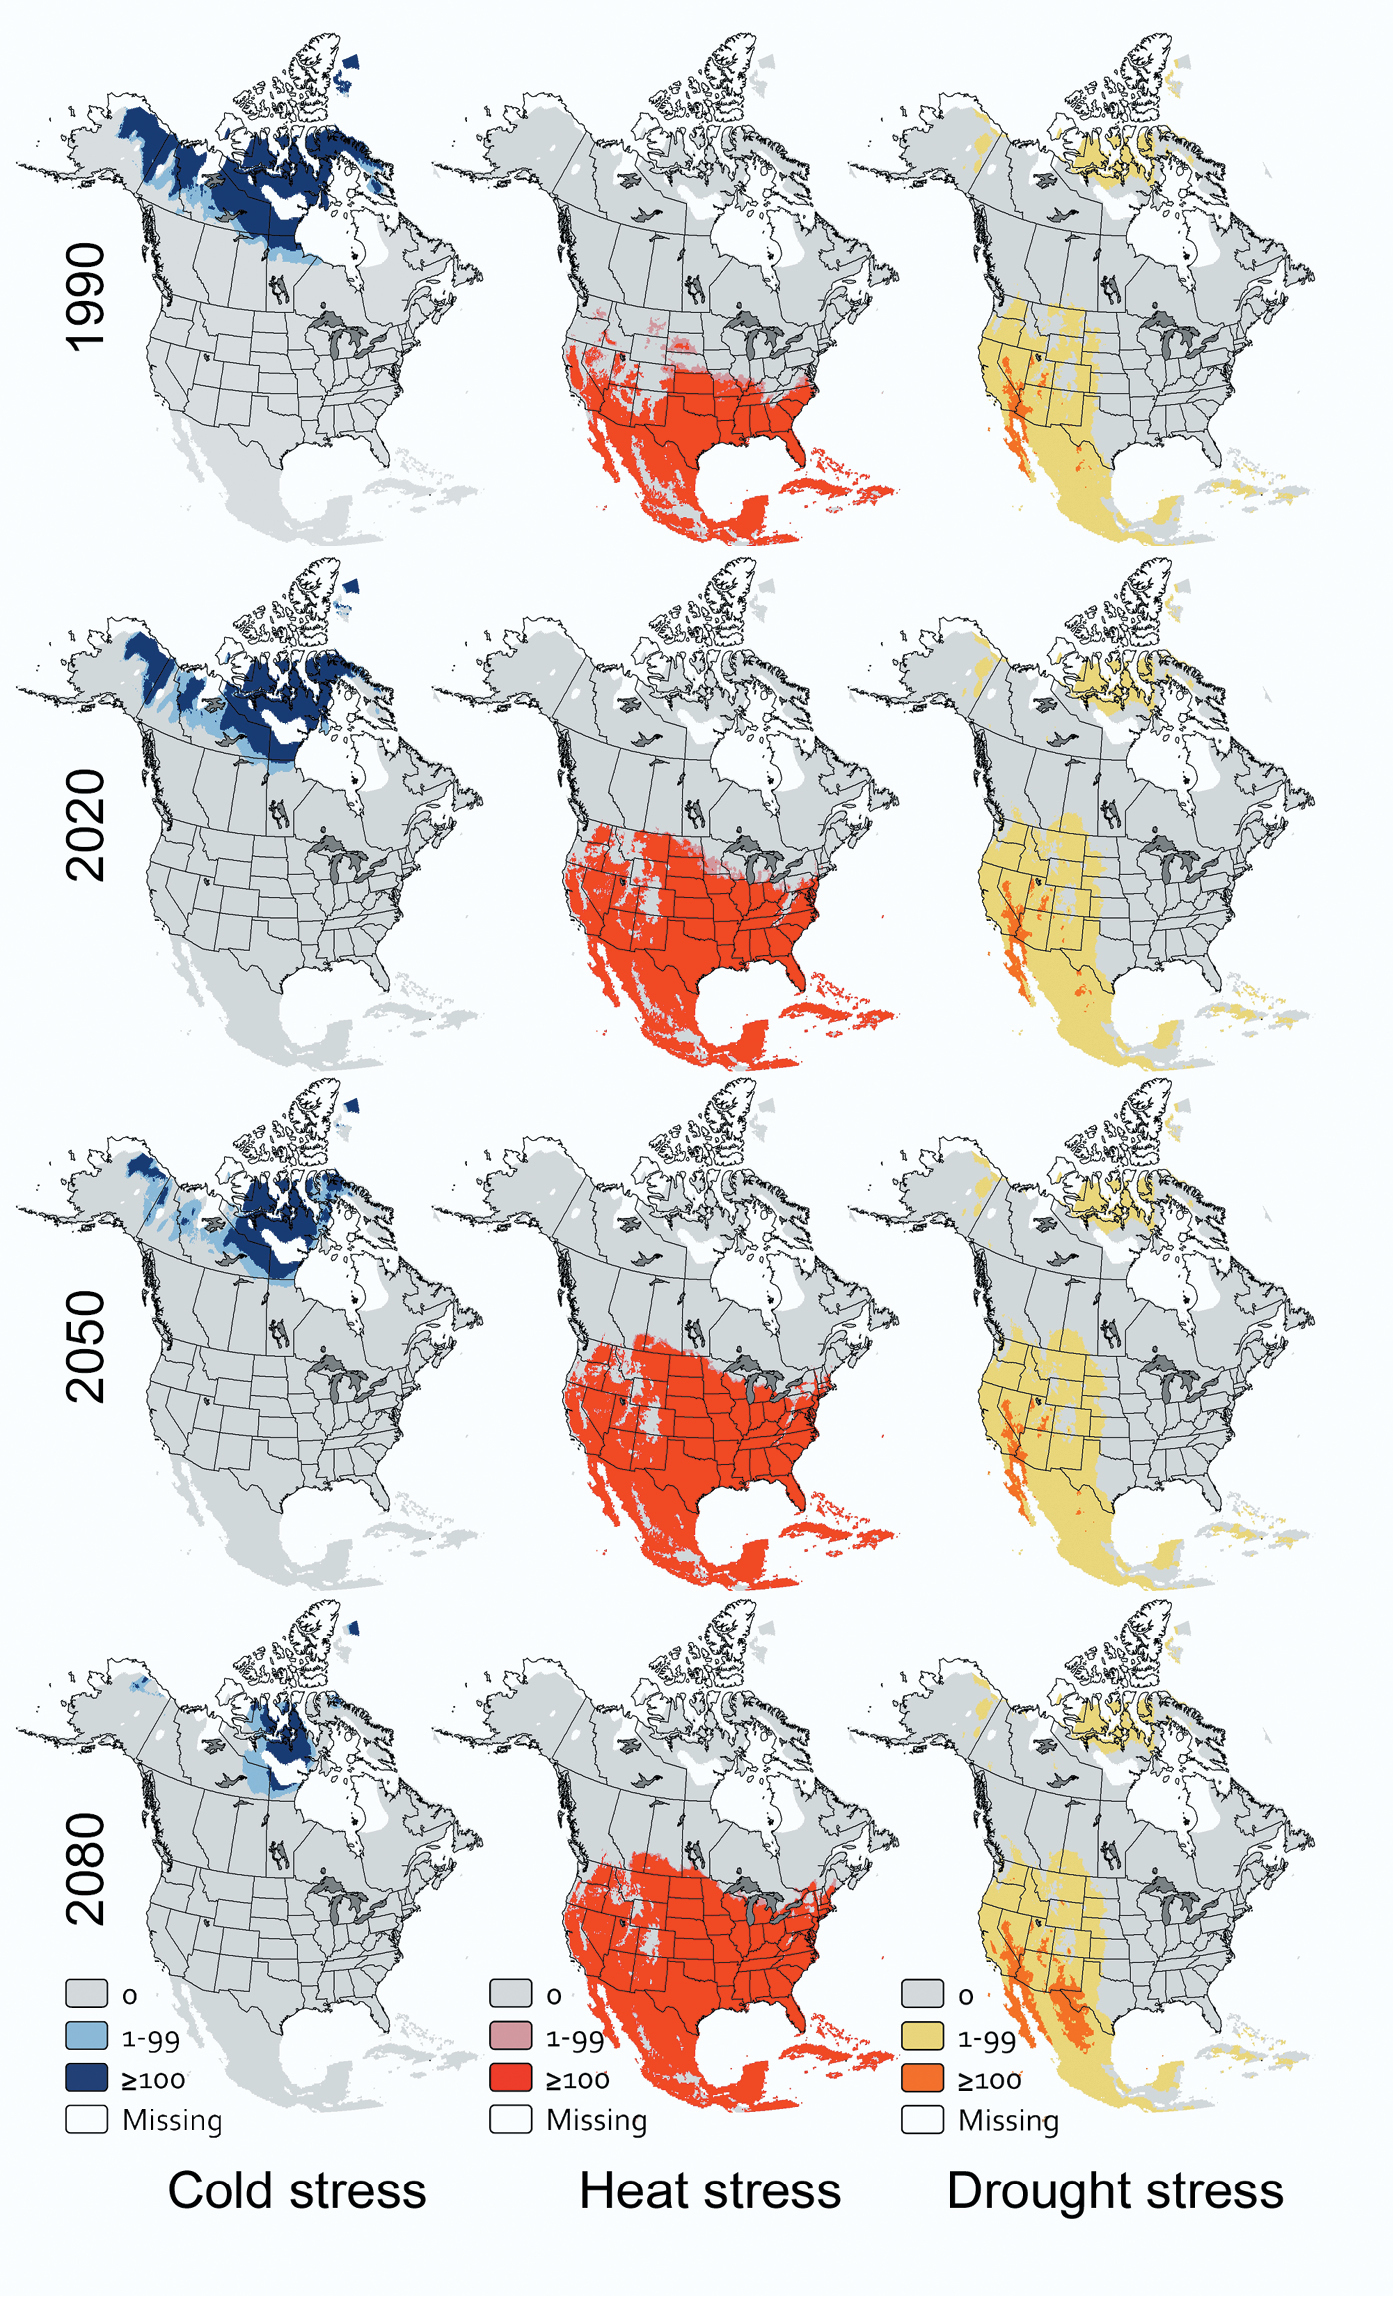
CLIMEX stress indices over time for Dothistroma septosporum in North America.
For Phytophthora ramorum, the future geographic extent of cold stress will decline over time (df = 2, 4; F=93.57; P<0.001) while the extent of heat stress will increase (df = 2, 4; F=19.04; P=0.009). The extent of drought stress is not projected to change (df = 2, 4; F=0.54; P=0.619). Currently, 31.9% of grid cells are too cold to maintain viable populations of Phytophthora ramorum year-round. These cells occur at high elevations and in northern portions of Canada and Alaska (Fig. 4). This extent of cold stress is forecasted to remain effectively unchanged through 2020. Then, the extent of cold stress will decline by 4-5% of grid cells in each subsequent 30-year projection horizon (Fig. 1C). By 2080, grid cells with a Cold Stress index > 99, will occur primarily in northern Labrador, northern Quebec, the Northwest Territories, the Yukon Territory, and northern Alaska (Fig. 4). Heat stress currently affects 11.5% of grid cells (Fig. 1C), generally south of 33°N latitude (Fig. 4). By 2020, the extent of heat stress is projected to increase to 18.4% of all grid cells and to continue to increase by approximately 4% of all grid cells in each subsequent projection horizon. By 2080, grid cells with a Heat Stress index > 99 will occur up to approximately 44°N latitude, except at high elevations (Fig. 4). Drought stress is expected to affect approximately 13% of all grid cells now and through 2080 (Fig. 1C), acting sporadically west of 99°W longitude (Fig. 4).
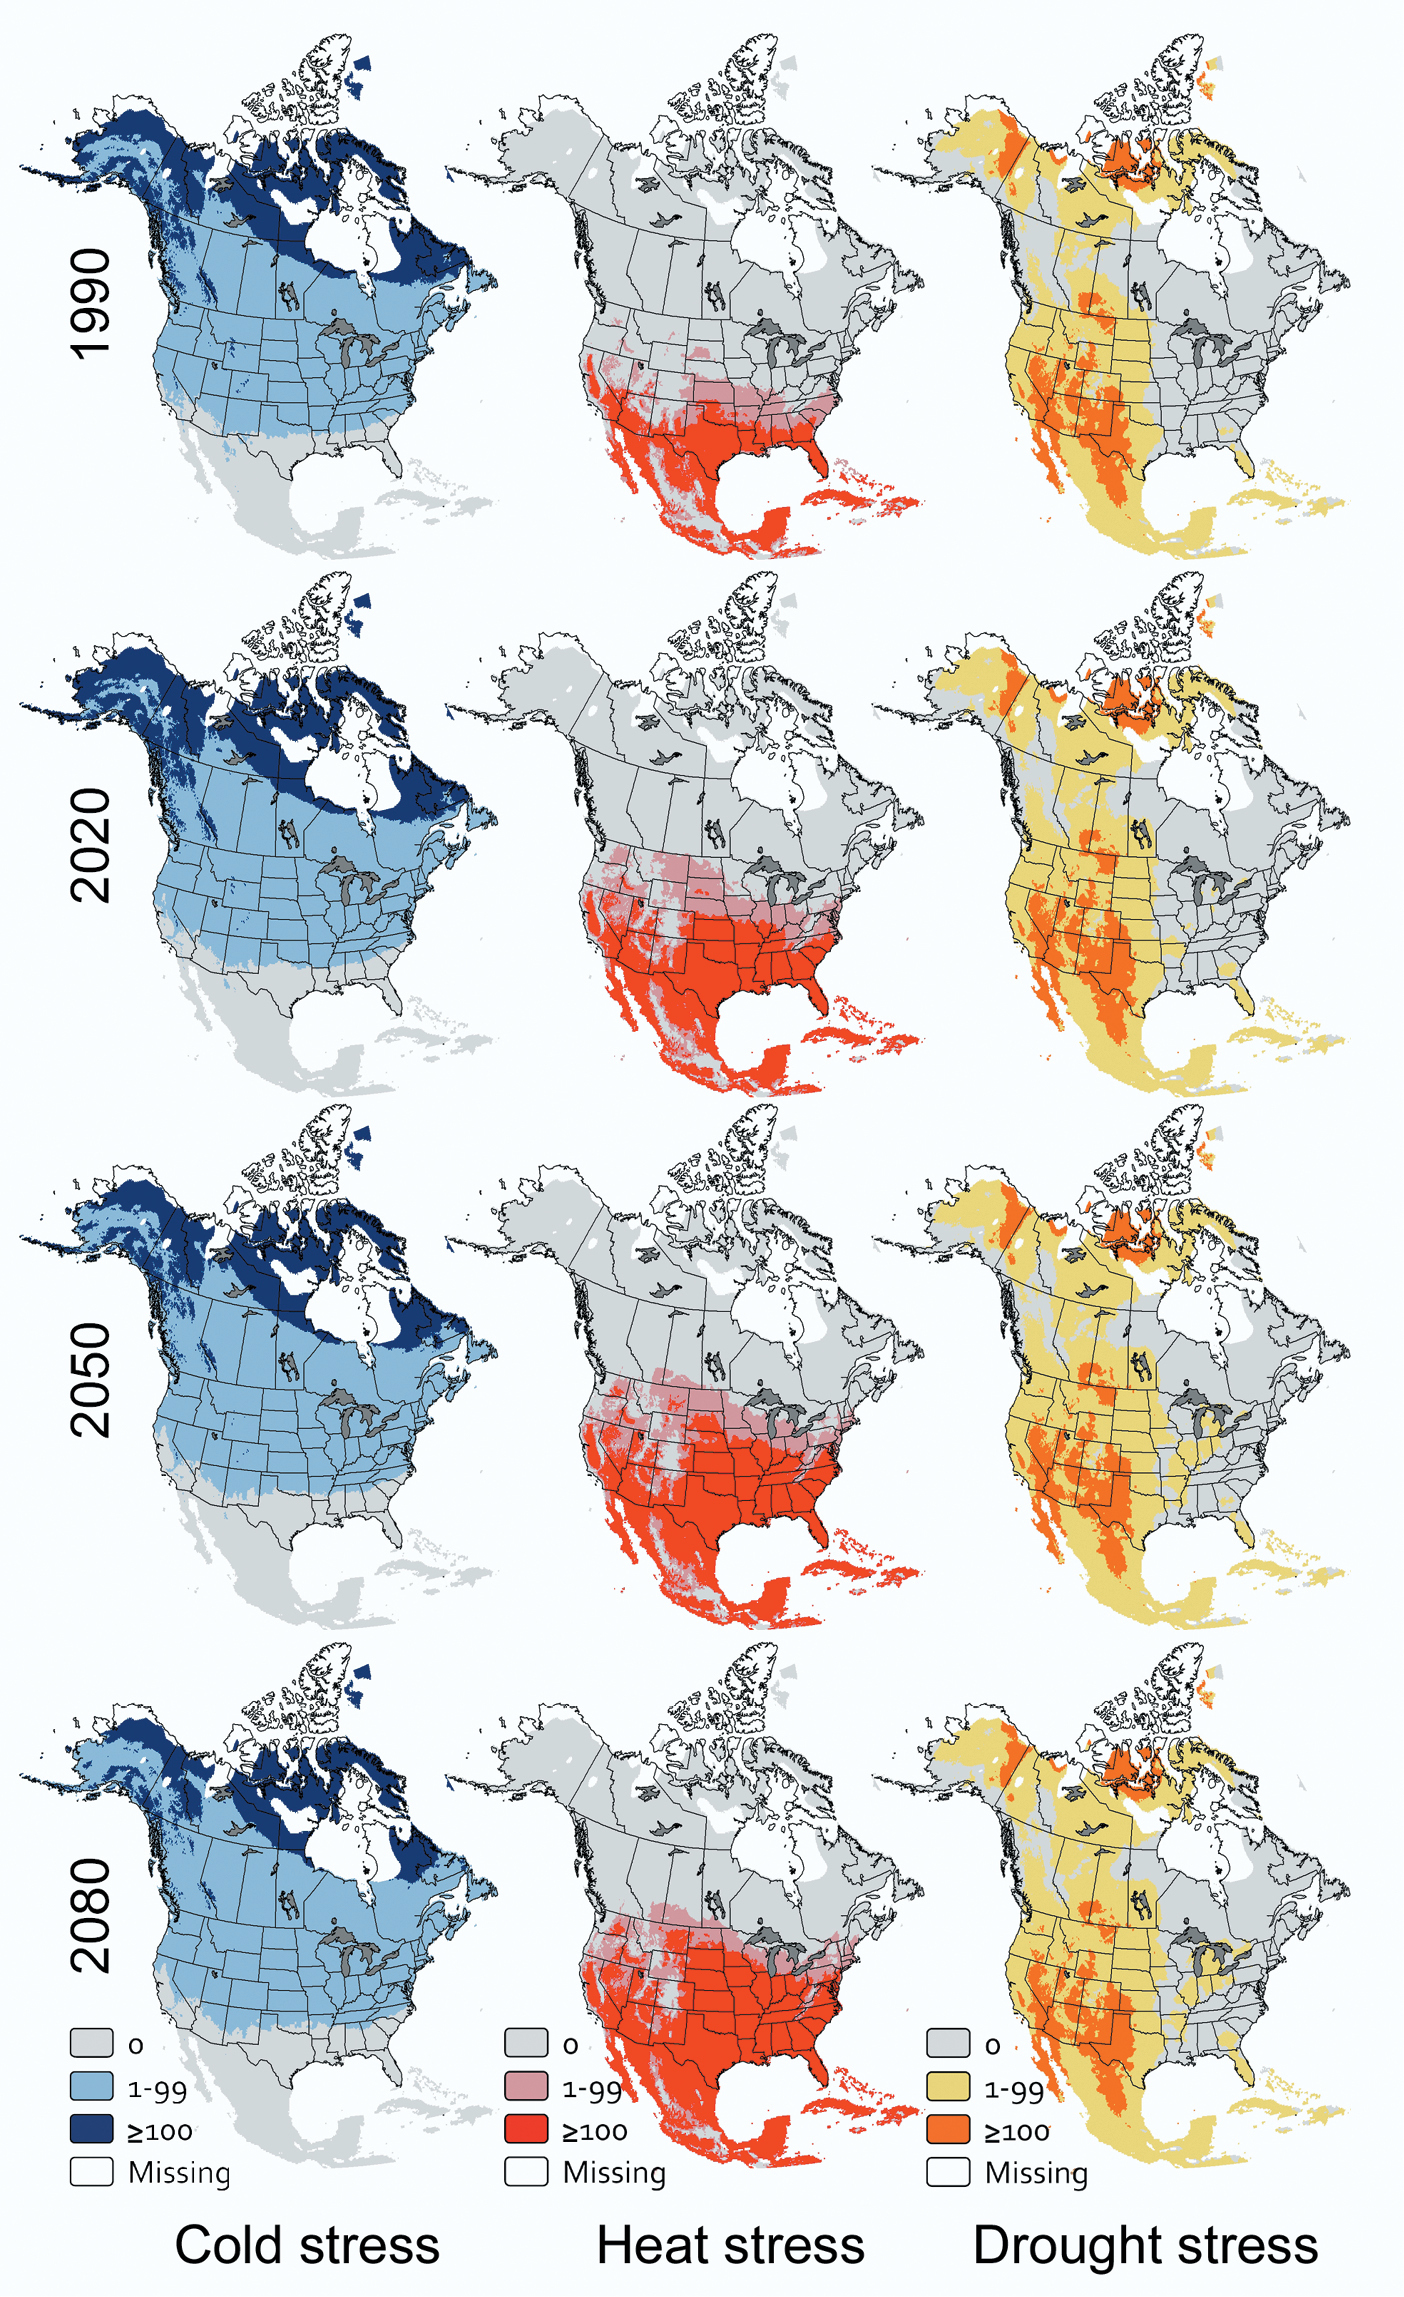
CLIMEX stress indices over time for Phytophthora ramorum in North America.
Effects of climate change on stress projections among pathogens. The three pathogens differed in the extent to which cold stress might currently constrain climate suitability for each species (df = 1, 12; F>34.38; P<0.001 for three contrasts). The current extent of cold stress for Arceuthobium tsugense is significantly greater than for Phytophthora ramorum, which itself has a greater extent of cold stress than Dothistroma septosporum (Table 3). The constant rate of change in the extent of cold stress over time was significantly less than 0 (Type 1 test of fixed effect of slope: df = 3, 6.83; F=22.90; P<0.001), but did not differ among the three pathogens (df = 1, 6.83; F<2.90; P≥0.134 for three contrasts).
The extent to which heat stress might currently limit climate suitability for Arceuthobium tsugense or Dothistroma septosporum was greater than for Phytophthora ramorum (Table 3; df = 1, 12.2; F>12.2; P≤0.001 for two contrasts), but the extent of heat stress that might currently act on Arceuthobium tsugense was not different from that extent for Dothistroma septosporum (df = 1, 12.2; F=1.74; P=0.211). The constant rate of change in the extent of heat stress over time was significantly greater than 0 (Type 1 test of fixed effect of slope: df = 3, 18.8; F=45.30; P<0.001), but did not differ among the three pathogens (Table 3; df = 1, 18.8; F<1.32; P≥0.265 for three contrasts).
The three pathogens differed in the extent to which drought stress might currently limit climate suitability of each species (df = 1, 18.8; F>18.8; P<0.001 for three contrasts). The extent of drought stress was greater for Arceuthobium tsugense than Phytophthora ramorum, which in turn had a greater extent of drought stress than Dothistroma septosporum. The constant rate of change in the extent of heat stress over time did not differ among the three pathogens (df = 1, 23.8; F≤1.65; P≥0.361 for three contrasts) and was not different from 0 (Type 1 test of fixed effect of slope: df=3, 23.8; F=0.61; P=0.614).
Effects of different general circulation models on stress projections for each pathogen. For Arceuthobium tsugense, different general circulation models yielded different estimates of the future extent of cold stress (df = 2, 4; F=13.57; P=0.016), heat stress (df = 2, 4; F=12.52; P=0.019), and drought stress (df = 2, 4; F=12.81; P=0.018). HadCM3 gave a greater extent of cold stress than CGCM1 or CSIROMK2; the extent of cold stress for Arceuthobium tsugense forecasted from CGCM1 and CSIROMK2 were similar (Table 2). CGCM1 gave a lesser extent of heat stress than CSIROMk2 or HadCM3; the extent of heat stress from CSIROMk2 and HadCM3 were similar. Forecasts of the extent of drought stress based on CGCM1 were greater than HadCM3, but such forecasts based on CSIROMk2 were not different from either of the other general circulation models.
Effect of general circulation models on extent of forecasted abiotic stresses for three forest pathogens
| Species | General circulation model | Cold stress (%±LSSE) |
Heat stress (%±LSSE) | Drought stress (%±LSSE) | |||
|---|---|---|---|---|---|---|---|
| Arceuthobium tsugense | CGCM1 | 71.6±0.6 | A | 32.3±0.3 | A | 52.5±0.6 | A |
| CSIROMk2 | 70.8±0.6 | A | 34.0±0.3 | B | 50.4±0.6 | AB | |
| HadCM3 | 74.7±0.6 | B | 34.2±0.3 | B | 48.0±0.6 | B | |
| Dothistroma septosporum | CGCM1 | 9.7±0.6 | A | 30.0±0.9 | A | 1.1±0.1 | A |
| CSIROMk2 | 6.2±0.6 | B | 35.0±0.9 | B | 1.4±0.1 | A | |
| HadCM3 | 12.1±0.6 | A | 33.6±0.9 | AB | 1.4±0.1 | A | |
| Phytophthora ramorum | CGCM1 | 29.6±0.5 | A | 20.0±0.9 | A | 14.1±0.6 | A |
| CSIROMk2 | 21.8±0.5 | B | 22.3±0.9 | A | 12.7±0.6 | A | |
| HadCM3 | 29.8±0.5 | A | 24.2±0.9 | A | 13.1±0.6 | A | |
† Extent is measured as the percentage (elsewhere in this manuscript, proportion) of 98, 224 grid cells in North America with a CLIMEX stress index > 99. Values represent the least-squares mean of three projection horizons: 2020; 2050; and 2080. Values for a species within a column followed by the same letter are not significantly different at α=0.05.
‡ least squares standard error.
Regression results for the proportion of North American grid cells with CLIMEX stress indices >99 over time
| Stress | Species | Intercept (±LSSE) |
Slope (±LSSE) | ||
|---|---|---|---|---|---|
| Cold | Arceuthobium tsugense | 0.78±0.02 | A | -0.03±0.01 | A |
| Dothistroma septosporum | 0.19±0.02 | C | -0.05±0.01 | A | |
| Phytophthora ramorum | 0.35±0.02 | B | -0.05±0.01 | A | |
| Heat | Arceuthobium tsugense | 0.26±0.02 | A | 0.03±0.01 | A |
| Dothistroma septosporum | 0.23±0.02 | A | 0.04±0.01 | A | |
| Phytophthora ramorum | 0.14±0.02 | B | 0.04±0.01 | A | |
| Drought | Arceuthobium tsugense | 0.49±0.01 | A | < -0.01±0.004 | A |
| Dothistroma septosporum | 0.01±0.01 | C | <0.01±0.004 | A | |
| Phytophthora ramorum | 0.14±0.01 | B | < -0.01±0.004 | A | |
† Stress indices were calculated in CLIMEX, and values > 99 indicate locations where a species is projected not to persist year-round due to that abiotic stress. Values for a stress within a column followed by the same letter are not significantly different at α = 0.05.
‡ least-squares standard error.
Different general circulation models yielded different estimates of the extent of cold stress for Dothistroma septosporum (df = 2, 4; F=22.08; P=0.007) and Phytophthora ramorum (df = 2, 4; F=93.57; P<0.001). For both pathogens, CSIROMk2 climate projections gave lower forecasts of the extent of cold stress than did CGCM1 or HadCM3 (Table 2). Though different general circulation models gave different estimates of the extent heat stress for Dothistroma septosporum (df = 2, 4; F=9.30; P=0.031), they did not differ for Phytophthora ramorum (df = 2, 4; F=5.83; P=0.065). For Dothistroma septosporum, the extent of heat stress based on CSIROMk2 was greater than the extent based on CGCM1; the projected extent of heat stress based on HadCM3 was not different from the other two general circulation models (Table 2). Estimates of the future extent of drought stress did not differ among general circulation models for Dothistroma septosporum (df = 2, 4; F=4.47; P=0.102) or Phytophthora ramorum (df = 2, 4; F=1.65; P=0.300).
These models suggest that the geographic extent of heat stress will increase, cold stress will decrease, and drought stress will remain constant throughout North America for all three forest pathogens. Rates of change were measured by the slopes of regression lines relating the extent of stress to time. The fact that the rates of change were the same for each species was a surprise (Table 3). These species have different biological characteristics, which are reflected partially in the differences in CLIMEX parameters among species (Table 1). The different CLIMEX parameter estimates led to substantially different forecasts of the current extent of cold stress, heat stress, and drought stress among the pathogens (Table 3). The reason for the similarity in the rate of change among pathogens for each stress remains unknown and will become the focus of future investigations.
CLIMEX parameters for these three pathogens are generally consistent with the notion that alien species have broader climatic tolerances than native species. The differences between the temperature thresholds for the onset of cold stress (TTCS) and heat stress (TTHS) and between the moisture thresholds for the onset of dry stress (SMDS) and wet stress (SMWS) provide a measure of the breadth of temperature and moisture tolerances, respectively. In general, the native Arceuthobium tsugense begins to experience heat stress when temperatures are cooler, cold stress when temperatures are warmer, and dry stress when soils are wetter than either alien species does. Different mechanisms of wet stress for Dothistroma septosporum and cold stress for Phytophthora ramorum complicate comparisons to the other two species.
With respect to my first hypothesis, I forecast that the native pathogen Arceuthobium tsugense will experience more direct abiotic stress in the future than either of the alien pathogens (Fig. 1). This future difference, though, stems from the substantially greater extent of abiotic stresses currently experienced by Arceuthobium tsugense than either alien pathogen considered in this study. Future climate conditions do not disproportionately affect the rate of change in the extent of stress experienced by the native pathogen over the two alien species. Thus, I cannot conclude that climate change is creating greater areas of suitable climate for alien pathogens than for native pathogens.
My results suggest that cold stress currently is having a substantial effect on climatically suitable areas for Arceuthobium tsugense, Dothistroma septosporum, and Phytophthora ramorum in North America. Cold stresses for Arceuthobium tsugense and Phytophthora ramorum currently extend over a greater area than heat stress or drought stress (Fig. 1A, C), and for Dothistroma septosporum, the extent of cold stress and heat stress are effectively the same (Fig. 1B). Cold is likely to remain the most extensive abiotic stress for Arceuthobium tsugense through 2080 (Fig. 1A) and for Phytophthora ramorum through approximately 2065 (Fig. 1C). For Dothistroma septosporum, however, cold stress will affect a smaller proportion of North America than heat stress by 2020. These results would support the value of additional research on the effects of cold temperatures on inoculum viability over time, especially for Arceuthobium tsugense and Phytophthora ramorum.
With respect to the second hypothesis, I found that general circulation models differed in the extent of abiotic stress projected for each pathogen. These patterns were not always consistent among pathogens. For example, forecasts of cold stress from HadCM3 were significantly greater than from CGCM1 or CSIROMk2 for Arceuthobium tsugense. For Dothistroma septosporum and Phytophthora ramorum, CSIROMk2-based forecasts suggested less cold stress than either of the other two general circulation models (Table 2). These results point to the value of considering multiple general circulation models when developing forecasts of where abiotic stresses might affect particular pathogens.
Climate change is likely to affect more than just the potential magnitude of abiotic stresses that act on these pathogens. Climate change may also directly affect the duration of temperature and moisture conditions that would be suitable or optimal for pathogen growth (
Management decisions in agroforestry and perennial cropping systems span decades, and decisions made today rely on assumptions about future productivity and marketability of a crop. For example, the decision about which species or genetic lines to plant at a site is a management choice with ramifications potentially for the next 30 to 100 years (
Pest risk maps that incorporate the effects of climate change should help land managers with longer-term planning activities and shorter-term management choices. For example, the maps developed as part of this project illustrate where abiotic stresses might exclude, or conversely might not exclude, three economically significant pathogens over time. So, these maps could be useful to decide whether trees with resistance to these pathogens should be planted, or if susceptible trees have already been planted, when to begin disease surveys. An additional benefit of these maps is that they capture complex dynamics (Figs 2–4). For example, while the total area that is at least marginal for Dothistroma septosporum is shrinking in North America, the area that is highly suitable is increasing (data not shown). So at a continental scale, climate change may be ameliorating some of the effects of this pathogen, but at a local or regional scale, climate change may be intensifying its effects. Qualitative characterizations of the effects of climate change are sensitive to the scales at which the assessments are made.
Forecasts of future disease activity based on climate normals will have limited utility over time. We found significant changes in abiotic stresses acting on each pathogen in each 30 yr projection horizon (Fig. 1). Our results suggest that models based on climate normals are likely to be useful for less than 30 yr.
CLIMEX focuses on abiotic drivers of population growth and death for ectothermic species. A benefit of this approach is that parameters have direct relevance to mechanisms underlying population change. Parameters estimated through inductive procedures, i.e., derived from known occurrences of a species, can suffer from some of the same limitations as other inductive species distribution models with respect to the vagaries of presence or absence records (
Cold stress is likely to preclude the year-round establishment of Arceuthobium tsugense, Dothistroma septosporum, and Phytophthora ramorum in many areas within North America.
With future climate change, the geographic extent of cold stress will diminish and allow for some northward movement in the range of climate suitability for these pathogens, but heat stress will increase and move southern range limits further north. Drought stress seems likely to act sporadically and not drive systematic changes the way temperature will.
The geographic extent of future cold stress, heat stress, and drought stress are forecasted to change at the same rate for the alien invasive pathogens Dothistroma septosporum and Phytophthora ramorum and the native pathogen Arceuthobium tsugense. Future differences in the extent of abiotic stresses are the result of current differences.
The general circulation models CGCM1, CSIROMk2, and HadCM3 occasionally yielded different forecasts of the extent of stress for one of the three forest pathogens.
Forecasts of future pathogen occurrence or activity based on historical climate are meaningful for less than 30 yrs, less than the time horizon for many decisions in forestry.
Adaptive management strategies are needed for resource managers to remain responsive to realized future changes in the distribution and activity of forest pathogens. Pest risk maps that depict forecasts of these changes should provide useful guidance but are constrained by several sources of uncertainty.
I thank Susan Frankel for her enthusiastic support of this project and Dave Shaw, Paul Hennon, Rona Sturrock, Alex Woods, Terry Shaw, and Jim Worrall for useful conversations about these pathogens. This work was supported, in part, by funds from the Western Wildland Environmental Threat Assessment Center (USDA Forest Service, Prineville, OR). Support of the sixth annual meeting of the International Pest Risk Mapping Workgroup by OECD’s Co-operative Research Programme is deeply appreciated.