


(C) 2013 Trond Rafoss. This is an open access article distributed under the terms of the Creative Commons Attribution License 3.0 (CC-BY), which permits unrestricted use, distribution, and reproduction in any medium, provided the original author and source are credited.
For reference, use of the paginated PDF or printed version of this article is recommended.
Citation: Rafoss T, Skahjem J, Johansen JA, Johannessen S, Nagothu US, Fløistad IS, Sletten A (2013) Improving pest risk assessment and management through the aid of geospatial information technology standards. In: Kriticos DJ, Venette RC (Eds) Advancing risk assessment models to address climate change, economics and uncertainty. NeoBiota 18: 119–130. doi: 10.3897/neobiota.18.4017
Delivery of geospatial information over the Internet for the management of risks from invasive alien species is an increasingly important service. The evolution of information technology standards for geospatial data is a key factor to simplify network publishing and exchange of maps and data. The World Wide Web Consortium (W3C)-geolocation specification is a recent addition that may prove useful for pest risk management. In this article we implement the W3C-geolocation specification and Open Geospatial Consortium (OGC) mapping standards in a Web browser application for smartphones and tablet computers to improve field surveys for alien invasive species. We report our first season field experiences using this tool for online mapping of plant disease outbreaks and host plant occurrence. It is expected that the improved field data collection tools will result in increased data availability and thereby new opportunities for risk assessment, because data-needs and availability are crucial for species distribution modelling and model-based forecasts of pest establishment potential. Finally, we close with a comment on the future potential of geospatial information standards to enhance the translation from data to decisions regarding pest risks, which should enable earlier detection of emerging risks as well as more robust projections of pest risks in novel areas. The forthcoming standard for processing of geospatial information, the Web Processing Standard (WPS), should open new technological capabilities both for automatic initiation and updating of risk assessment models based on new incoming data, and subsequent early warning.
Pest, risk, mapping, mobile, GPS, geospatial, standards
Historical evidence shows that species composition and abundance are changing in time and space. This is not only evident in natural ecosystems, but also in managed ecosystems like agriculture and forestry. However, the rate of change has increased dramatically in modern times due to the globalization of trade and the movement of organisms to parts of the world where they have not been before. Climate change is expected to further affect species’ distributions and their phenology. The risks related to these changes are well known for both natural and agricultural resources, including loss of biodiversity, crop loss and increased pest problems (
When human society faces major new global challenges, solutions based on new technological developments are commonly suggested. So what about technological solutions for reducing pest risks? The role of technology for reducing these risks has received some attention in the literature.
In this article we focus on two relatively new information technology standards; the World Wide Web Consortium (W3C) Geolocation specification and the Open Geospatial Consortium (OGC) Web Processing Service. We discuss how these standards can contribute to risk reduction. Based on the former standard we present one new Web-tool for online pest field mapping of plant pests and host plants, while for the latter standards we discuss the potential and opportunities offered for prediction of future pest establishment. Geoport, the new Web-tool reported here, has also been tested to work directly towards biodiversity databases and the biodiversity data standard “Darwin Core.” This data standard was proposed by the community of end-users and has been widely implemented, thereby providing volumes of data to better reveal global patterns of biodiversity (
The W3C-geolocation specification and support for its Application Programming Interface (API) were implemented in most Internet browsers after its publication. For mobile network devices having an Internet browser, like smartphones and tablet computers have, the result of such an implementation is standardized and simplified access to location information. By pointing the Internet browser to a certain Web-address that makes use of the W3C-geolocation functionality, providing direct access to the GPS hardware chip device for a Web-application, the user can immediately start to do online data recording to central storage from the field. In order to secure privacy, it is a compulsory part of the standard that the user always is asked for permission to allow the Web-page/Web-application access to the location information. The ease of access to Web-based user location information was the single most important factor triggering our initiative to expand on our previous work on network-linked field tools for online pest data recording (
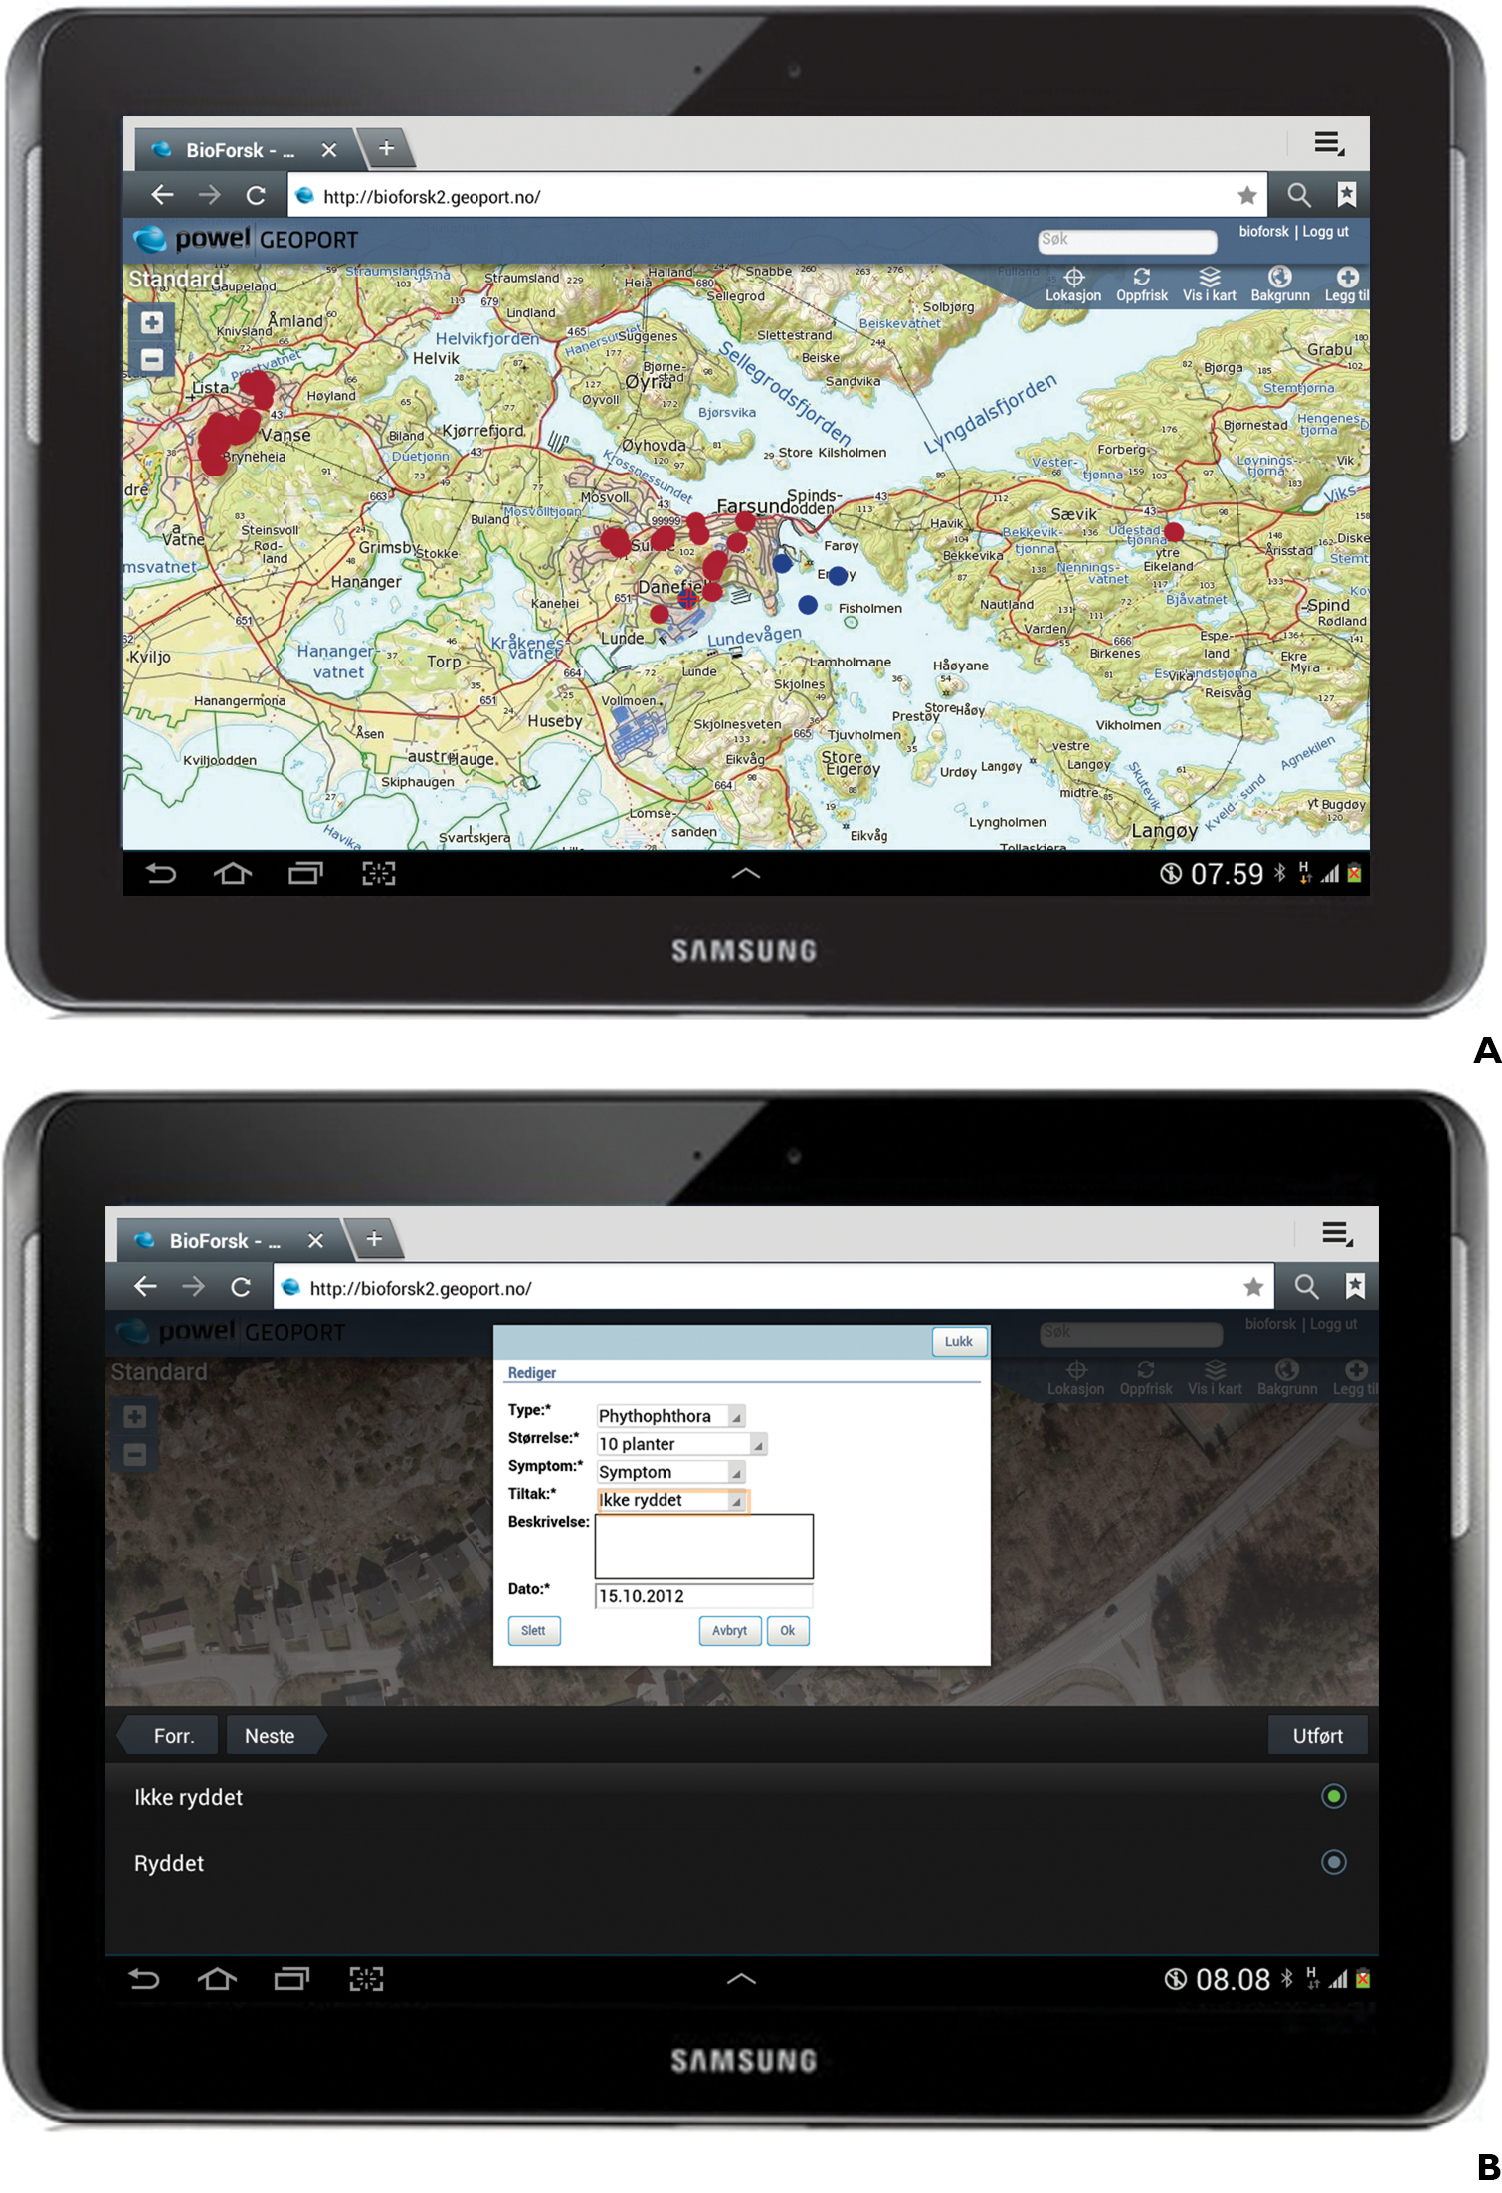
Geoport displayed in an Internet browser running on a tablet. Upper figure shows existing mapped data on top of a topographic map, while the lower figure shows the dialog for registering new data, with background map switched to aerial imagery (orthophoto).
According to
Geolocation based on GPS signals regularly involves two sources of accuracy error under field conditions: (1) local reflection of GPS signals from large objects like buildings or trees, that can be falsely recorded by the GPS device and (2) error in the signal emerging from variation in solar activity that distort the GPS signals as they pass through the Earth’s ionosphere. In the situation where large objects in the vicinity affect the accuracy of signals, the user can intervene by switching to an aerial photography background map and then directly assessing the accuracy by comparing the physical surroundings to what is shown on the aerial photo around the position indicator. Moreover, in such situations the application can be set to allow the user to manually position the data recording in the map. For the second source of error, correction services delivered by various commercial suppliers improve accuracy down to the decimetre or centimetre or centimeter level. Such correction information was once available only for advanced GPS receivers equipped with an additional radio receiver, as these correction signals were disseminated along FM-radio channel signals. However, in recent years, these correction signals have also started to be disseminated over the mobile telephone network. This new option was considered to be implemented as an additional functionality of Geoport, but would have required programming of an additional software module that is not part of the Geolocation API standard to handle the signal code. To obtain this kind of increased accuracy, users would be required to buy access to such services from national suppliers. Although we considered the availability of GPS correction signals within the mobile network signal to be an interesting new option, we decided not to implement support for it in the current version. For the purpose of recording field data on pests, the position accuracy of 3-4 meters typically obtained when the solar activity is the only source of distortion, was considered sufficiently accurate. The quality of the hardware and the positioning averaging algorithms implemented by the hardware vendor can also affect position accuracy. However, based on our experience with smartphones and tablets from different main producers, all current technologies provide adequate position accuracy. The Geolocation API itself has an optional parameter “enableHighAccuracy” in the set of instructions for position acquisition. This attribute is implemented in the API to provide a hint that the application would like to receive the best possible results. Another intended purpose of this attribute is to allow other applications to inform the Geolocation application that they do not require high accuracy geolocation information, therefore, the implementation can avoid using geolocation components (e.g., GPS) that consume a significant amount of power. For Geoport we chose to activate the “enableHighAccuracy” option by default in order to ensure that the device always provided the most accurate position it is able to deliver, although this results in the slowest response times and largest power consumption. One alternative not yet enabled in the current version of Geoport is to allow the user to switch on and off this “enableHighAccuracy” parameter, which in practice would mean to make more use of the manual placement option based on high quality aerial map background. However, this will break with some of the automatic quality control principles of this data collection principle where time and space attributes of the data recording could be set by the system without the user being able to manipulate them.
Based on our previous experiences with OpenGIS® Web Feature Service Interface Standard (WFS) we chose to design the Geoport web application to allow data recording against any data source supporting Web Feature Service Transaction (WFS-T). There are now several software products, both commercial and open-source based, supporting WFS-transactions (e.g. GeoServer, TinyOWS and ArcGIS Server) with most kinds of geographical data sources like file-based formats (e.g. ESRI Shape files) or database servers with support for geographic data types (e.g. PostgreSQL/PostGIS, Oracle Spatial, ArcSDE). In the following section, we introduce some of the technical principles to facilitate flow of species data records over the Internet, and furthermore, how eventually new data records can be used to trigger events like pest management actions or pest risk assessment re-analysis.
According to the OGC (
- Create a new feature instance
- Delete a feature instance
- Update a feature instance
- Lock a feature instance
- Get or query features based on spatial and non-spatial constraints”
A subset of the above described operations of the WFS specification has been named as Web Feature Service Transactions or WFS-T in abbreviated form. The subset of the first four operations listed above constitutes the necessary operations to allow for full editing functionality for geospatial data over the Internet. While the WFS provide the information behind maps, and no map images, the OpenGIS® Web Map Service Interface Standard (WMS) does provide map images that also could be transparent to combine map layers from one or multiple servers (
In order to allow different functionality, we decided to implement two modes of operation of Geoport on two different network addresses. One mode allowed the user to control placement of field recordings on the map. In this mode, GPS information is used to centre the map on the device only and the geographical coordinates for data recording are captured where the user taps to insert a new data point. A second mode had no option for user interaction except from placement of the mapping device itself (smartphone or tablet) at the position of the point of interest. In this mode the geographical coordinates for data recording are taken directly from the GPS when a new data point is recorded. The former mode is desirable when positions of interest are difficult to access, e.g. in wetlands (bogs, lakes etc), while the benefit of the latter mode is that data are collected where the device is located.
A mapping session with the Geoport Web application initiates by starting up an Internet browser on the tablet or smartphone and then by entering the Web address. While there is no need for manual installation beforehand like for native applications, successful loading of the application requires network connection. After loading the application the user is asked to allow sharing of the geographical position. This is an integrated part of the W3C-geolocation specification to protect privacy. The user can respond to the request either by sharing the geographical location information once for the actual application session or for future application sessions or to not share the location information (for which the latter option prohibits the application from proceeding into a mapping session). In the mapping session previously registered data is shown by Style Layer Descriptors (SLD) on top of a background map (Fig. 1A) that could be switched between topographic or aerial imagery (orthophoto). The previously collected data shown in the map is coming directly as WFS data from the same data source as the data collection is operating. Background maps are delivered over a WMS service. To record new data, the user taps the “+” button which brings up a user dialog with predefined menu options for “type of registration”, “quantity”, “symptom”, “action taken” and a free text field for comments (Fig. 1B). The date and geographical coordinates are captured automatically from the device. The final action for the user to complete is to press “OK” which fires the WFS transaction. The WFS server then feeds back a message telling the user whether the data was safely secured at the server or not. The application returns to normal mapping mode at the current position.
This Web application, run from a tablet device, offered several advantages for field data collection over handheld GPS-devices or first generation smart mobiles without touch screen. Tablets have much greater battery capacity than mobile phones, and the battery will not run out during the working day. The relatively large screen on a tablet also provided a better overview of data collected and map information. Fine details in the high quality background maps and aerial imagery provided by the Norwegian Mapping Authority become evident on the larger tablet screen. The detailed information on surroundings and the good overview is helpful in the working situation. Use of the touch screen was also more convenient on the tablet compared to the smartphone because the symbols were larger and easier to tap (although this could be adjusted at the expense of visible map information).
Geoport can in principle be used anywhere in the world. It can be configured to use any background map layers as long as they are available over the WMS standard or the other Internet-based map distribution formats supported by the OpenLayers library. It has been tested in various parts of the world when configured to use map layers offered by Google’s Google Maps service. For use in Norway, we chose to use the map services offered by the Land Registry and Cadastre (STATKART) as they offer the highest quality maps and aerial imagery for Norway. Geoport is not publically accessible as it is now distributed as a commercial product from the private company Powel based in Norway. However, the software on which Geoport is based, OpenLayers, is publically accessible as it is published as an “open source” software library at http://openlayers.org.
The greatest use of Geoport so far has been in the on-going nation-wide survey and eradication campaign in Norway against the plant pathogenic bacterium Erwinia amylovora which causes fire blight in pears, apples and some other members of the family Rosaceae (
The geoport application has also been successfully used at a smaller scale to register vascular invasive plants in Norway and to record data in agricultural fields in India.
In the context of risk assessment and risk management of pests, geospatial information standards that can facilitate development of new knowledge from collected species occurrence data should be of high interest. The various approaches and algorithms developed to project whether species can establish and spread into novel areas based on the species’ current distributions (see
An earlier Norwegian study on the use of standardized information technology for risk management of pests, demonstrated the potential for chaining of Web-services for automatic warning messaging to be sent to potentially affected farmers and other stakeholders, based on events registered into a Web-client developed for the desktop office computer (
In a risk assessment context, server side routine checks could be set up on the in-coming pest data that could trigger pest risk analysis, or re-analysis, when the new data fulfil certain criteria identifying a potential emerging risk. The new abilities to constantly update field data could generate potential for a new level of immediacy not previously seen in the process of pest risk modelling. In order for this to be a new feature of the pest risk assessment process, risk assessment routines must be dynamically linked to the species presence/absence databases in a way that re-analysis could easily be invoked or even automatically triggered when new data are accumulated. If species distribution models were available as WPS services, we might experience similar effects of lowered effort needs following from of standardization as reported for field data collection in this article and by
Chaining (linking) species distribution models to species distribution databases by standards support may also further facilitate the step from assessment to management. Pest risk management procedures, e.g. emergency warnings and contingency plans, could be held up-to-date from risk assessment model based knowledge on range expansion of pests and associated scientific advice.
There is little doubt that the current processes of globalization of trade in agricultural commodities and climate change are speeding up the rate of change in both natural- and agro-ecosystems. The risks emerging from these changes to food security and biodiversity are well documented. The role of technology in mitigating these risks needs as a general topic is beyond scope of this paper, but our study shows how technology can aid in keeping track of these changes and how principles of standardization can reduce the effort needed to put together efficient tools to track and potentially eradicate pests. Most of the mapping software coming with smartphones and tablets today readily allows field data collection. However, these tools normally allows little customization and standards support, even in their accompanying APIs that are offered to give more flexibility. Typically these applications cannot be customized to capture desired attributes and not configured to operate against user-defined data stores. The amount of information that should be collected while in the field is another interesting aspect that deserves discussion. On one hand, ideally it should handle all the information fields that are required for a biodiversity record according to the biodiversity data standard “Darwin Core”, e.g. see
Another aspect that is highly relevant from a pest risk assessment perspective is the use of such tools to document true absence of species. In combination with a robust predefined sampling strategy, the tool described in this paper should have a great potential to improve the availability of true absence data that generally are scarce. Combining the predefined sampling strategy with citizen science is another interesting opportunity that potentially could generate high interest and high utility for pest risk assessment and management. Scientists could take advantage of the fact that smartphones and tablets lend themselves to provide guidance to the citizen science by combining text and multimedia and thereby improve the quality of the information collected by the public. This could be one way to alleviate the general scarcity of true absence data by use of modern technology and society involvement.
For the future we would like to see expansion of functionality to define new data sources from the field by having a user interface that automatically configures and set up new remote data sources that can be initiated to receive field data. At present, functions that allow creation of new data stores are not covered by any of the standards for geospatial information. We would also like to see good functionality to handle absence data for species distribution mapping.
Smartphones and tablets are now readily available and their costs are going down. Based on an open source JavaScript library and utilization of open standards for geospatial information, the Geoport Web-application offers a platform independent tool for field data collection with a great potential to fight the risks posed by pests to food security and biodiversity. As location based technology and informatics help to simplify the collection of pest data, we recommend that pest risk analysts should make greater use of innovations in geospatial information technology and standards. Species distribution models should be linked to species distribution databases, e.g. as chained WPS services that could be triggered by new pest data occurrences according to certain criteria and thereby warn about potentially emerging risks. Detection of emerging risks at an early stage by automatic triggering of prediction algorithms when a species appear outside its currently known distribution range can allow for earlier action and thereby reducing risks from pests.