NeoBiota 18: 103–118, doi: 10.3897/neobiota.18.4019
Understanding trade pathways to target biosecurity surveillance
Manuel Colunga-Garcia 1, Robert A. Haack 2, Roger D. Magarey 3, Daniel M. Borchert 4
1 Center for Global Change and Earth Observations, Michigan State University, 1405 S. Harrison Road, Suite 205, East Lansing, MI 48823 USA
2  USDA Forest Service, Northern Research Station, 1407 S. Harrison Road, Suite 220, East Lansing, MI 48823 USA
3  Center for Integrated Pest Management, North Carolina State University, 1730 Varsity Drive, Suite 300, Raleigh, NC 27606 USA
4  Animal and Plant Health Inspection Service, Plant Protection and Quarantine, Center for Plant Health Science and Technology, Plant Epidemiology and Risk Analysis Laboratory, 1730 Varsity Drive, Suite 300, Raleigh, NC 27606 USA

Corresponding author: Manuel Colunga-Garcia (colunga@msu.edu)

Academic editor: R. Venette

received 21 September 2012 | accepted 30 April 2013 | Published 13 September 2013


(C) 2013 Manuel Colunga-Garcia. This is an open access article distributed under the terms of the Creative Commons Attribution License 3.0 (CC-BY), which permits unrestricted use, distribution, and reproduction in any medium, provided the original author and source are credited.


For reference, use of the paginated PDF or printed version of this article is recommended.

Citation: Colunga-Garcia M, Haack RA, Magarey RD, Borchert DM (2013) Understanding trade pathways to target biosecurity surveillance. In: Kriticos DJ, Venette RC (Eds) Advancing risk assessment models to address climate change, economics and uncertainty. NeoBiota 18: 103–118. doi: 10.3897/neobiota.18.4019

Abstract

Increasing trends in global trade make it extremely difficult to prevent the entry of all potential invasive species (IS). Establishing early detection strategies thus becomes an important part of the continuum used to reduce the introduction of invasive species. One part necessary to ensure the success of these strategies is the determination of priority survey areas based on invasion pressure. We used a pathway-centred conceptual model of pest invasion to address these questions: what role does global trade play in invasion pressure of plant ecosystems and how could an understanding of this role be used to enhance early detection strategies? We concluded that the relative level of invasion pressure for destination ecosystems can be influenced by the intensity of pathway usage (import volume and frequency), the number and type of pathways with a similar destination, and the number of different ecological regions that serve as the source for imports to the same destination. As these factors increase, pressure typically intensifies because of increasing a) propagule pressure, b) likelihood of transporting pests with higher intrinsic invasion potential, and c) likelihood of transporting pests into ecosystems with higher invasibility. We used maritime containerized imports of live plants into the contiguous U.S. as a case study to illustrate the practical implications of the model to determine hotspot areas of relative invasion pressure for agricultural and forest ecosystems (two ecosystems with high potential invasibility). Our results illustrated the importance of how a pathway-centred model could be used to highlight potential target areas for early detection strategies for IS. Many of the hotspots in agricultural and forest ecosystems were within major U.S. metropolitan areas. Invasion ecologists can utilize pathway-centred conceptual models to a) better understand the role of human-mediated pathways in pest establishment, b) enhance current methodologies for IS risk analysis, and c) develop strategies for IS early detection-rapid response programs.

Keywords

Global trade, invasive species, pest risk analysis, early detection, invasion pressure, ecosystem invasibility, propagule pressure, agricultural ecosystems, forest ecosystems

Introduction

Biological invasions can produce severe environmental and economic impacts in plant ecosystems worldwide (Pimentel 2009, Vilà et al. 2010, Scalera 2010, Aukema et al. 2011), and the threat of new invasions will continue to be of global concern in the years ahead (Pejchar and Mooney 2009, Ziska et al. 2010, Lugo and Gonzalez 2010, Pyšek and Richardson 2010, Bradley et al. 2012). Global trade has been widely acknowledged as one of the leading causes of the introduction of invasive species (IS) (Meyerson and Mooney 2007, Westphal et al. 2008, Hulme 2009, Perrings et al. 2009). In the continuum of approaches used against IS in plant ecosystems, initial efforts are focused on the prevention of their entrance, which is the primary responsibility of the National Plant Protection Organizations (NPPOs) in each country (Magarey et al. 2009). NPPOs, however, face an ever-increasing challenge in this regard. In 1995, the World Trade Organization Agreement on the Application of Sanitary and Phytosanitary Measures (SPS) (SPS Agreement) entered into force. With regard to plant ecosystems, the SPS Agreement lays out rights and obligations for member countries to protect the health of plants from the introduction and spread of pests and diseases. The SPS Agreement requires measures, commonly based on international standards, which are aimed to prevent the entry of pests and diseases while ensuring that such measures are not used as unjustified barriers to trade. SPS measures that are not based on international standards must be technically justified and based on scientific evidence (usually through a risk assessment) (World Trade Organization 2010). Despite SPS measures and related efforts by countries to prevent the entry of IS there is the potential of novel introductions with increasing trends in the volume and origin of international cargo. This underscores the importance of establishing early-detection strategies for the detection of IS that may be introduced into a country.

Given the above challenges, countries implement approaches against IS based on early detection-rapid response strategies (Mehta et al. 2007, Rabaglia et al. 2008, Simpson et al. 2009, Britton et al. 2010). These strategies include the following components: a) detection networks including syndromic surveillance; b) research and training; c) stakeholder participation; d) integration of technologies to facilitate detection and communication of knowledge, skills, and data; and e) taxonomic support, including availability of voucher specimens and authoritative verifications (National Invasive Species Council 2003). Early detection networks, often operating under limited resources, should focus on high-priority targets including “high-risk locations, high-value resources, important pathways, and populations and species of specific concern” (National Invasive Species Council 2003). For the particular case of trade-mediated introductions, we propose in this paper to include the concept of invasion pressure as a criterion to highlight potential at-risk locations for early detection purposes. Invasion pressure, which is the probability that an ecosystem experiences an invasion within a specified time period, results from the interaction of three factors: propagule pressure, species invasion potential, and ecosystem invasibility (Lonsdale 1999, Davis 2009). For the purpose of this paper, we define propagule as a shipment in a pathway at any point in time and space that is infested, infected, or contaminated by IS. We assume that IS are viable at arrival and have an intrinsic potential to establish. Building on the definition of the International Plant Protection Convention (2012a), a pathway is any means (commodity, container, and/or conveyance) that allows the entry or spread of IS. Propagule pressure is thus a measure of the number of individuals in a shipment and the rate at which shipments arrive per unit of time (Simberloff 2009). Species invasion potential is the intrinsic ability of species to invade an ecosystem (di Castri 1989). Finally, ecosystem invasibility is the overall susceptibility of an ecosystem (Williamson 1996) due to factors such as climate, susceptibility of native species, and disturbance. To use the invasion pressure criterion in the selection of target locations for early detection programs, we need to answer two questions: what role does global trade play in invasion pressure of plant ecosystems, and how could an understanding of this role be used to enhance early detection strategies?

To answer the above questions, we framed the interaction between global trade and biological invasions using a pathway-centred invasion model (Fig. 1). As previously defined, a pathway can be any combination of a commodity, a container, or a conveyance (truck, plane, marine vessel, etc.) that facilitates the entry of an IS. It implies the existence of an origin and a destination, which in our model we label as the source and destination ecosystems, respectively. The uptake phase occurs when an IS infests (or infects, in the case of pathogens) a commodity, or when an IS is simply present (as a contaminant) on a commodity, or on or in a container or conveyance. The transport phase is the movement of the conveyance from origin to destination. The release phase of IS takes place at the destination end of the pathway and either of two situations can lead to an invasion. First, the IS can be released into a suitable habitat (in which case release and entry occur simultaneously). Second, the IS can be released into a situation that facilitates access to a suitable habitat (in which case release and entry are separated in time). The uptake, transport, and release phases are driven by logistic and freight distribution processes dictated by urban, production, and transportation systems. After release, ecological processes take over to determine whether the IS is able to establish and spread. Ecological processes also influence the occurrence of IS during the uptake phase.

Figure 1.

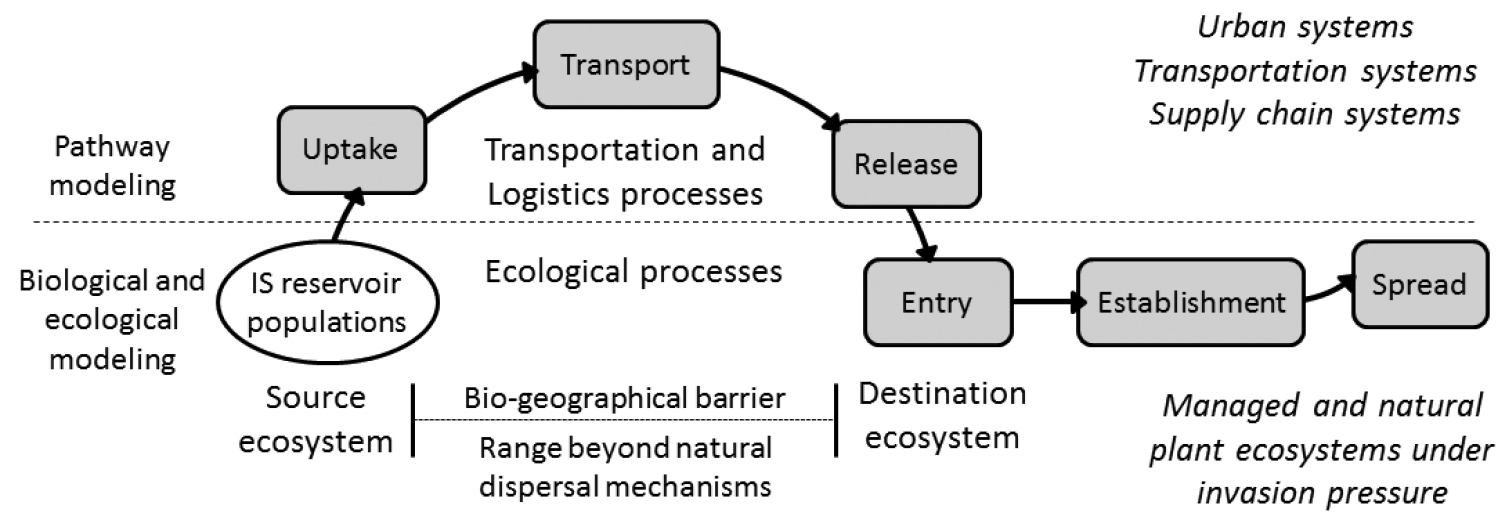
Schematic diagram of a multi-stage invasion model that links global movement of traded goods (as part of the transportation and supply chain systems) to movement of invasive species (IS). This model was adapted from Isard et al. (2005) in which long-range dispersion of invasive species was depicted via atmospheric pathways and also includes concepts by Colautti and MacIsaac (2004) and Rodrigue et al. (2009).

What then is the answer to our first question, i.e., what role does global trade play in invasion pressure of plant ecosystems? Based on the pathway-centred invasion model (Fig. 1), the level of invasion pressure experienced by destination ecosystems can be influenced by the intensity of pathway usage, the number of pathways with similar destinations, and the number of different ecological source regions for imports to the same destination. High-intensity pathway usage, high numbers of single destination pathways, and high numbers of source ecological regions can result in high invasion pressure because they increase a) propagule pressure, b) the diversity of IS transported (which may increase the likelihood of transporting IS with high intrinsic invasion potential), and c) the likelihood of transporting IS that can take advantage of an ecosystem with high potential invasibility. It is important however, to clarify that when propagule pressure is estimated using a proxy variable (e.g., volume of freight shipments) we cannot estimate invasion pressure per se. This is because we do not know the type and number of IS (if any) present in the freight shipment. Instead we should use the term relative invasion pressure to emphasize the fact that high and low values (of invasion pressure) are only relative to the space/time continuum under study. Subsequent risk analysis could be implemented to determine the actual risk experienced by areas under high relative invasion pressure. To answer the second question (how could an understanding of this role be used to enhance early detection strategies?), we will illustrate the use of this model to characterize the relative invasion potential of two plant ecosystems with a case study. In this case study, we will quantify the relative invasion pressure in agricultural and forest ecosystems due to U.S. imports via a single pathway (maritime containerized imports of live plants). Foreshadowing our results, we will show that this pathway places higher relative invasion pressure on several agricultural and forest areas in the U.S., including many that occur within major metropolitan areas. Finally, we will highlight the implications of our model for researchers and policymakers who deal with IS. We anticipate that the principles discussed in the present paper can also be applied and utilized as a framework to examine the invasion pressure of plant ecosystems via other pathways.

Case study: U.S. maritime containerized imports of live plants
Background

The value of global live plant trade has increased worldwide in the last decade (Fig. A1 in Appendix). Globally in 2011, the U.S. ranked 9th in exports and 2nd in imports with 2% and 9.3% shares of the world exports and imports of live plants, respectively (Tables A1, A2 in Appendix). Maritime containerized imports represented 64.4% of the total value of all live plants imported into the U.S. in 2010. This value is after excluding fresh cut flowers (which are imported almost exclusively via the air conveyance pathway) (Table A3 in Appendix) and live plant imports from Mexico and Canada (which are imported via the land conveyance pathway such as truck or rail) (Table A4 in Appendix). The increase in trade of live plants has intensified concerns as they constitute a pathway for the introduction of invasive plant pests or pathogens (Reichard and White 2001, Brasier 2008, Drew et al. 2010, Bradley et al. 2012, Liebhold et al. 2012, Parke and Grünwald 2012). In fact, on a commodity categorization scale of 1 to 4 where 4 represents commodities with the highest potential to introduce and spread pests, live plants are categorized as either 3 or 4 (International Plant Protection Convention 2009). Category 3, which includes cut flowers, refers to commodities that have not been processed and are intended for consumption or processing. Category 4 includes commodities that have not been processed and whose intended use is planting. Live plants in this last category (serially ranked from highest to lowest based on risk) include rooted plants in pots; bare root plants; bulbs and tubers; root fragments, root cuttings, rootlets or rhizomes; rooted cuttings; unrooted cuttings; and budwood/graftwood (International Plant Protection Convention 2012b). U.S. regulations of live plant imports are implemented via Plant Inspection Stations which besides inspections make sure that standard protocols for treatments are followed (Animal and Plant Health Inspection Service 2007, 2011, 2012a, b). When high risk IS are found associated with the imported live plants, fumigation treatments are implemented, a procedure that often targets other IS present on the commodity.

Methods

To quantify the intensity of pathway usage we acquired a full set of PIERS® (http://www.piers.com) records for U.S. maritime containerized imports of live plants (Harmonized System Code = 06) during 2010. Data fields included vessel name, number of TEUs (i.e., Twenty-Foot Equivalent Unit containers), tonnes, place/port of container loading with live plants, and U.S. port of destination. Places/ports were geocoded using a variety of public domain sources including the World Port Source®, GEOnet Names Server (GNS), and Bing® maps. In the case of places whose names were the same as other places in the same country, an effort was made to search online to determine if those names were associated with places that commonly exported live plants. If this was not successful, the place was not included in the analysis. Because some U.S. ports that are involved in live plant trade are in close geographic proximity to each other (e.g., the ports of Long Beach and Los Angeles in California), we grouped them by their encompassing metropolitan area. Finally, we computed the daily number of TEUs between the origin of the containers (i.e., the place/port where live plants were loaded into a container) and the destination (i.e., the U.S. metropolitan area of the port of entry). Because data records in PIERS® include fractions of TEUs (i.e., when only a portion of a container is occupied with live plants), the sum of TEUs becomes only a measure of import volume and does not reflect the actual number of individual containers. Due to data availability for this study, our analysis focused on live plants in general. However, Tables A3 and A4 in Appendix provide insight into the types of live plants that were included in the maritime containerized imports to the U.S. in 2010 (and hence in the analyses found in this paper).

To provide an indicator of the potential diversity of IS transported into the U.S. we quantified the number of ecological regions from which live plant imports originated throughout the world and where they entered and moved to in the U.S., we used the world ecoregion classification by Olson et al. (2001). This classification system divides the world into 14 biomes, which are subdivided into 867 ecoregions. Each port or place of origin for the live plant imports in our dataset was assigned to the biome and ecoregion it intersected. We computed the number of biomes and associated ecoregions that served as the origin for the live plant imports that arrived in each U.S. metropolitan area and state.

To determine areas beyond the U.S. ports of entry that could be under high relative invasion pressure we modelled the final destination of live plant imports at the U.S. county level. First we acquired monthly data on U.S. maritime containerized imports of live plants during 2010 from USA Trade® Online (https://www.usatradeonline.gov). This dataset included country of origin, weight imported, and U.S. state of destination. Then we acquired from Hoovers Inc. (http://www.hoovers.com) a list of geocoded retail nurseries, garden stores and other establishments engaging in the sale of ornamental nursery products in 2010–2011. This list contained, among other information, the total revenue per establishment, which was used to obtain the total revenue for all establishments within a county. We aggregated the revenue at the county level due to the uncertainty of knowing which establishments actually imported live plants in 2010. Moreover, sales of live plants are not occurring only at those speciali- zed establishments, but also at home improvement stores and mass merchandisers throughout the U.S. (Waterman 2012). Therefore, revenue was used as an indicator of live plant demand in a county. We then computed the proportion of county revenue with respect to the total state revenue. This proportion was used as a weight factor to disaggregate State imports of live plants and produce a map of the likely destinations of live plant imports at the county level. This county-level map was intersected with the county centroids of the U.S. land-use based maps (agriculture and forest) from Colunga-Garcia et al. (2010a). Using the resulting maps (agriculture and forest centred maps for counties that were destinations for live plant imports) we estimated hotspots for potential invasion in those two plant ecosystems. To perform this procedure we used the software GeoDa (Anselin et al. 2006) and computed the Moran’s I to detect clusters of counties with high volume of imports. Moran’s I is a local indicator of spatial association (Anselin 1995), and in our case, it detected which counties were the destinations of significantly higher volume of live plant imports than the mean volume for the entire contiguous U.S. (Fortin and Dale 2005).

Results

Live plant imports to the U.S. in 2010 that entered via the maritime containerized pathway originated from 276 distinct places in 76 countries. These imports arrived at U.S. seaports located in 15 metropolitan areas within 13 states of the contiguous U.S. (Fig. 4B). Three metropolitan areas accounted for 72.2% of all containerized live-plant maritime imports entering the U.S. in 2010: Los Angeles-Long Beach-Santa Ana in the state of California (37.3%), New York-Northern New Jersey-Long Island which included parts of the states of New York, New Jersey, and Pennsylvania (23.3%); and Miami-Fort Lauderdale-Pompano Beach in the state of Florida (11.6%) (Fig. 2). For brevity we designated those metropolitan areas as Los Angeles, New York, and Miami, respectively. The source areas of these live plant imports represented 102 ecoregions within 13 biomes (Fig. 4A). However, 40.4% of the live plant imports originated from the temperate broadleaf/mixed forest and 40% came from the tropical and subtropical moist broadleaf forest biome. In addition, the source areas within these same two biomes contributed 53% of the 102 ecoregions, representing 31 and 23 ecoregions, respectively. The three aforementioned metropolitan areas not only received large volumes of live plant imports but also received imports from a large number of ecoregions (Fig. 2). A visual display of the variation in weekly imports of live plants in 2010 by biome of the source area (Fig. 3) showed that the New York metropolitan area exhibited certain seasonality in imports with a large spike between the months of August and October and less activity between May and June. In contrast, the other two metropolitan areas depicted in Fig. 3 (Los Angeles and Miami) showed less variation in the volume of imports throughout the year. Another observation to note is that while the tropical and subtropical moist broadleaf forests biome was a major contributor to the live plant imports entering Los Angeles and Miami, the temperate broadleaf/mixed forest biome was the major contributor for imports entering New York.

Figure 2.

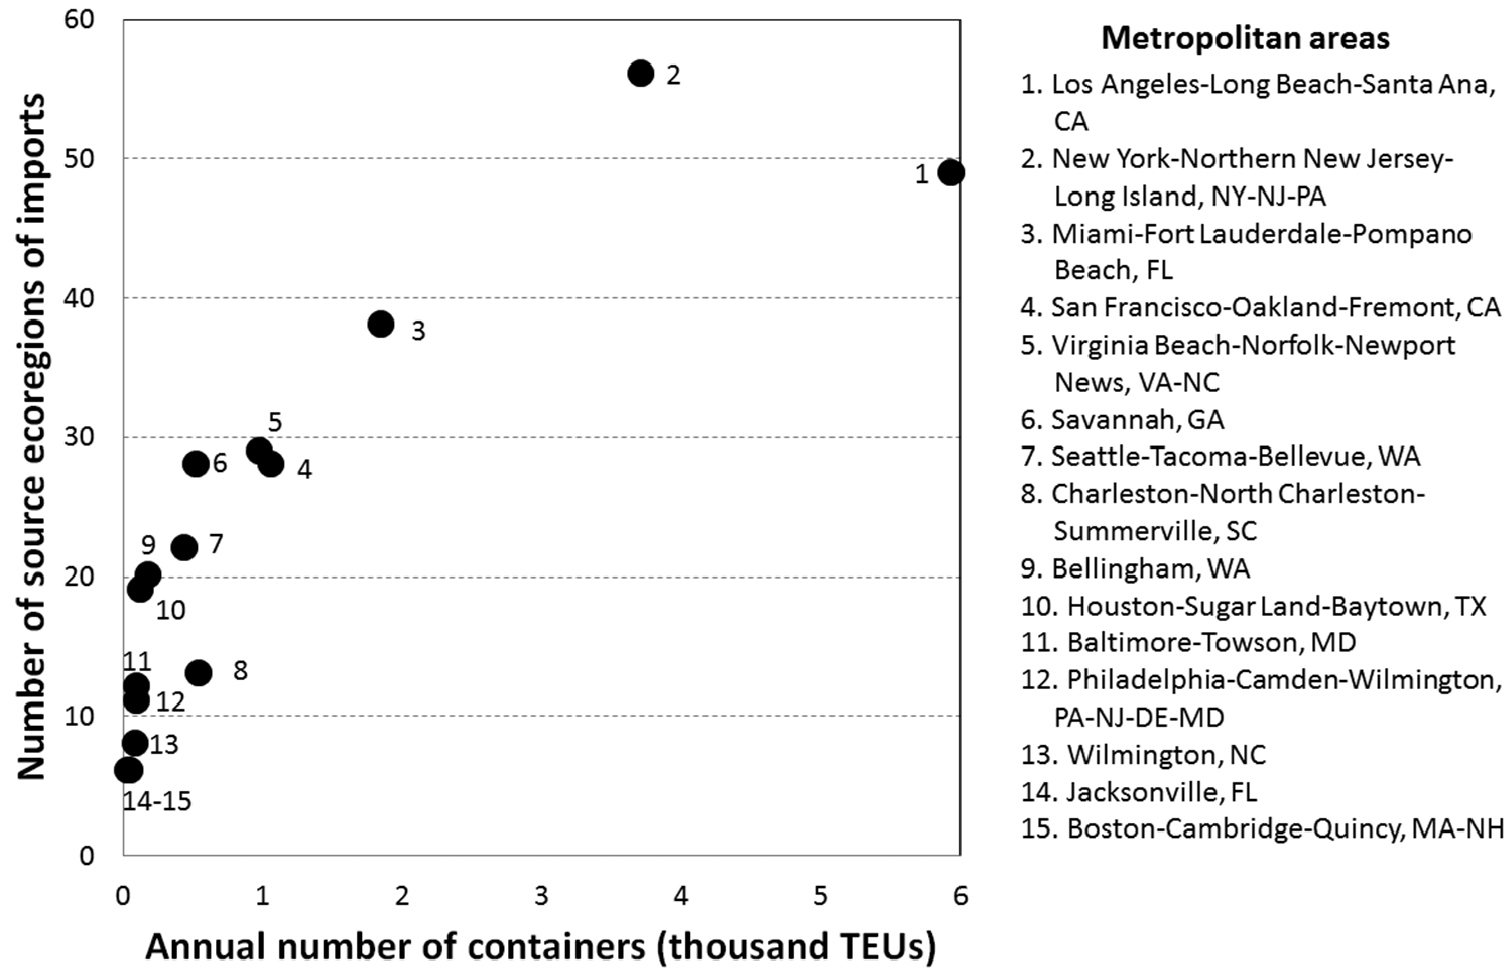
Relative invasion pressure of invasive species (IS) at seaports within selected metropolitan areas in the contiguous U.S. via maritime containerized imports of live plants. The number of source ecoregions is used as an indicator of potential IS diversity, while the number of containers (TEU = container length in Twenty-foot Equivalent Units) with live plants is used as an indicator of relative IS propagule pressure. Data sources: PIERS® port to port data and World Ecoregions (Olsen et al. 2011).

Figure 3.

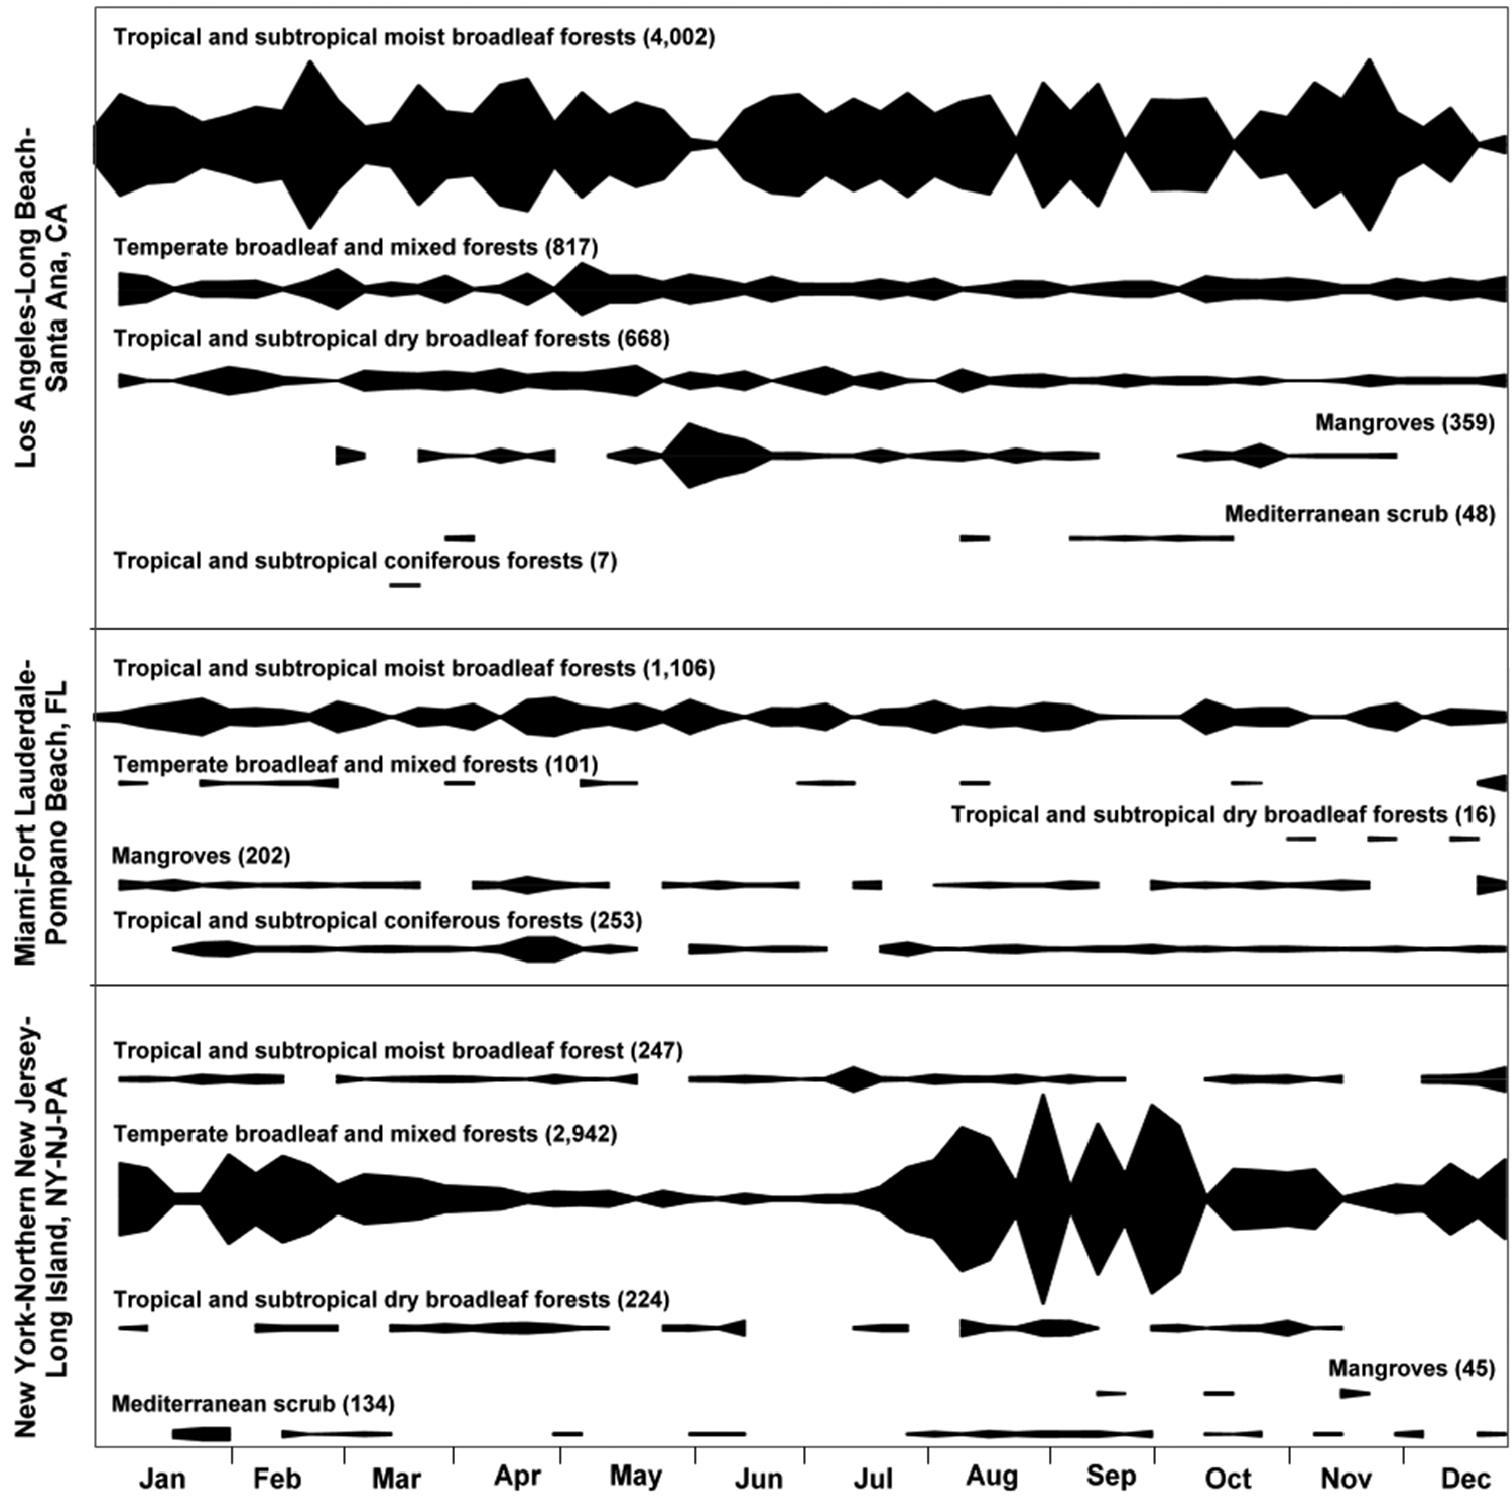
Trend in weekly number of maritime containerized imports (TEUs) of live plants entering the contiguous U.S. in 2010 at seaports in three selected metropolitan areas. Imports were classified according to the likely biome where the live plants were loaded within the country of origin. Numbers in parentheses for each biome refer to the total number of containers (TEUs) that arrived with live plants in 2010. The blackened areas for each biome type represent the trend in live plant imports at weekly intervals in 2010 based on the total number of TEUs indicated in parenthesis. PIERS® port to port data and World Ecoregions (Olsen et al. 2011).

Figure 4.

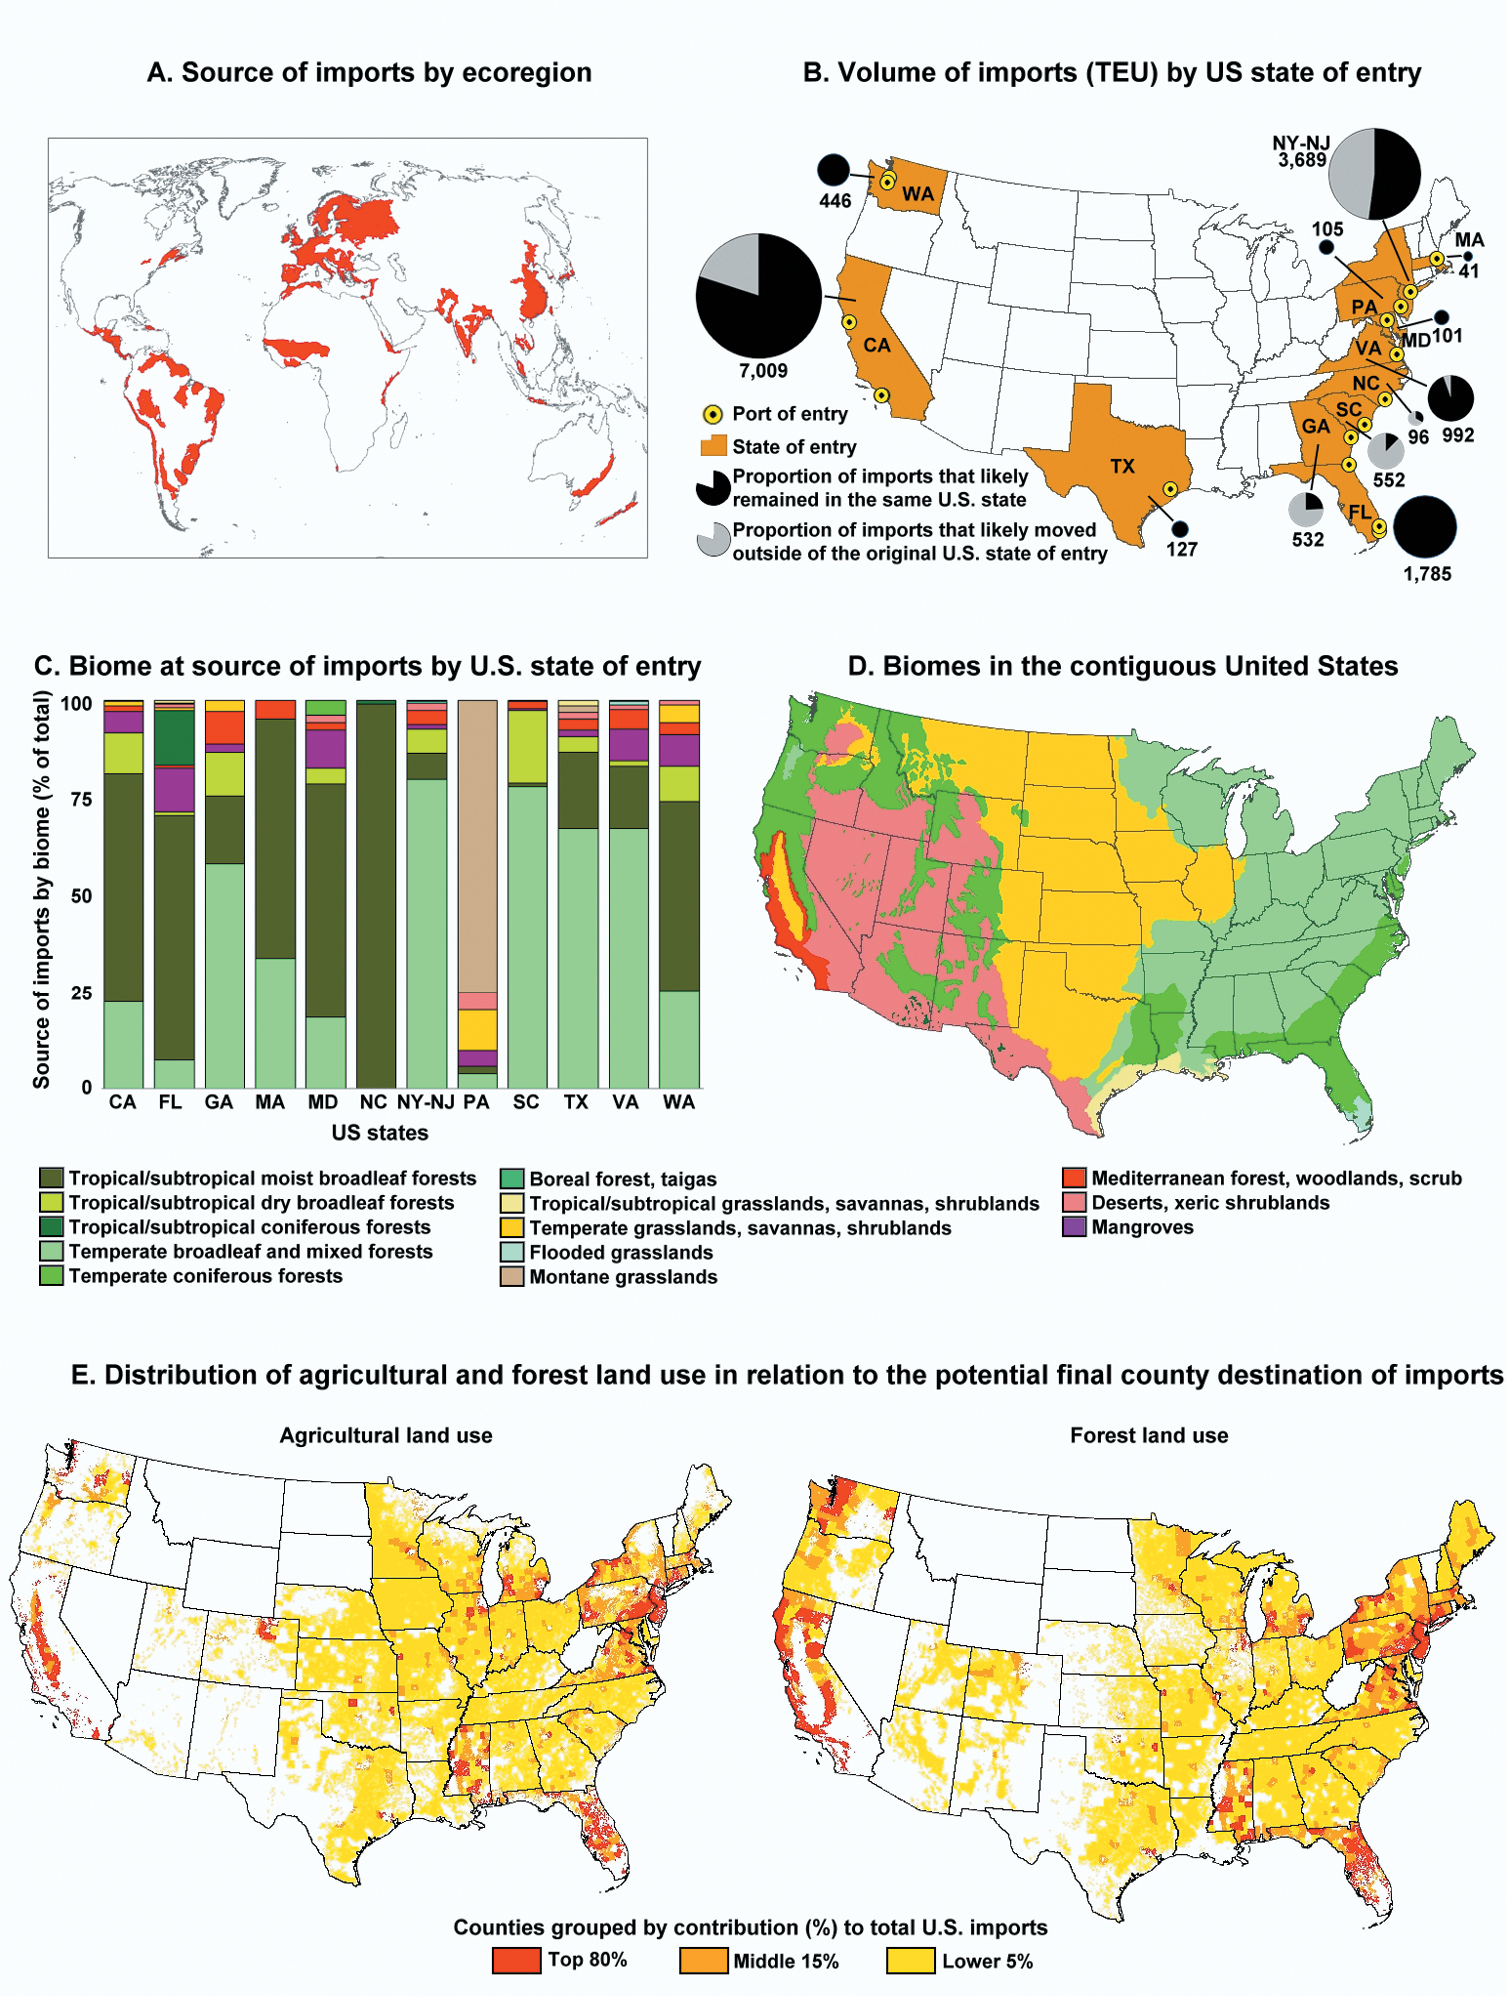
Maritime containerized imports of live plants entering the contiguous U.S. in 2010 from their source to their final destination. A Likely source areas of imported live plants by ecoregions (areas in red) B Volume of imports (TEUs) with live plants by U.S. state of entry. State abbreviations: CA California, FL Florida, GA Georgia, MA Massachusetts, MD Maryland, NC North Carolina, NY-NJ New York-New Jersey, PA Pennsylvania, SC South Carolina, TX Texas, VA Virginia, WA Washington C Biome at the source of the imported live plants by destination state D Biomes of the contiguous U.S E Distribution of agricultural and forest land use in relation to the potential final county destination of live plant imports.

The maps in Fig. 4E indicate that many counties (2, 422) served as the likely final destination for the live plant imports that arrived in the U.S. via the maritime containerized pathway in 2010. Overall, the top 80% of live plant imports (by volume) were likely shipped to 182 counties in the contiguous U.S., the next 15% of the imports went to another 368 counties, and the remaining 5% of imports went to another 1872 counties (Tables A5, A6 in Appendix). Of the 182 counties that received 80% of the imports in 2010, 154 (84.6%) were located in metropolitan areas and received 74.2% of all live plant imports that entered the contiguous U.S. The analysis (Fig. 5) revealed that most of California, Florida, New Jersey, and Connecticut and portions of Washington, New York, Pennsylvania, and Maryland are potentially under high relative invasion pressure under the analyzed pathway. Of the 157 U.S. counties that fell within hotspots of relative invasion pressure, 154 had agricultural land and 143 had forest land, and of these, 134 (87%) and 125 (87.4%) counties, respectively, fell within metropolitan areas. The counties with agricultural and forest ecosystems received 64.5 and 63.3% of the live plant imports to the contiguous U.S. in 2010, respectively.

Figure 5.

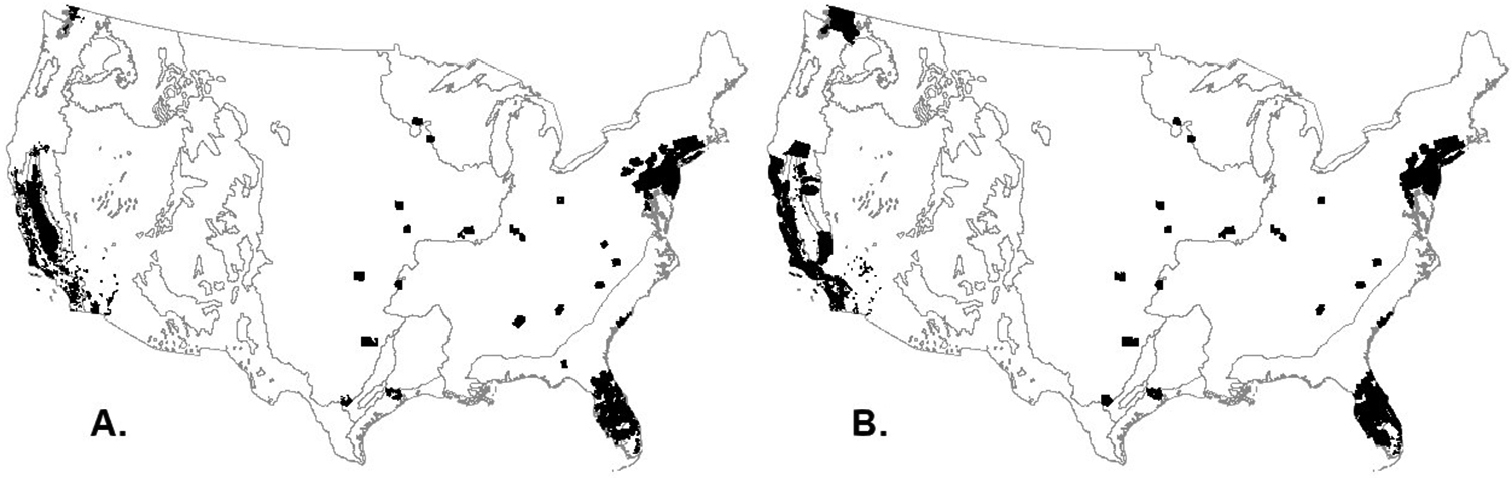
Potential hotspots of relative invasion pressure to IS associated with maritime containerized imports of live plants in the contiguous U.S. in 2010. A Agricultural ecosystems B Forest ecosystems. Contour lines separate major U.S. biomes as shown in Fig. 4E.

Discussion

At the beginning of this paper, we posed two questions: What role does global trade play in invasion pressure of plant ecosystems? And how could an understanding of this role be utilized to enhance early detection strategies? We answered the first question in the introduction by explaining the implications of a pathway centred invasion model. We addressed the second question with the case study. Given the risk of live plant imports as an IS pathway (International Plant Protection Convention 2009), USDA-APHIS puts special effort in the surveillance of this pathway (Animal and Plant Health Inspection Service 2007). However, IS that escape detection at ports of entry could potentially establish in the hotspot areas of relative invasion pressure identified by our model. The hotspot areas in the northeastern U.S. (Fig. 5) are likely the result of imports entering the New York metropolitan area, which is a major gateway for large volumes of imports that originate from many different world ecoregions (Fig. 2). The major biome encompassing the hotspots in the northeastern U.S. (i.e., temperate broadleaf/mixed forest) (compare Figs 4D and 5) is similar to the dominant biome that is the source of most live-plant imports that enter through the New York metropolitan area (Fig. 3). Such a relationship between source and destination biomes indicates that IS that gain access to plant ecosystems in the northeastern hotspot areas are likely to find suitable conditions for their establishment. In contrast with the northeastern hotspots, a mixture of biomes comprises the source regions for live plant imports in the southwestern U.S. and these do not match well with the biomes that encompass the hotspots. This does not preclude invasion in the Southwest, but it forces one to think about what types of IS would thrive best in such hotspots and under what circumstances. The use of irrigation or other manipulations of the environment in the Southwest may provide suitable microclimates for IS to establish. If these areas are recognized as being within a hotspot for relative invasion pressure and a subsequent risk analysis determines the area as high risk then by regularly monitoring for IS there is a good chance that new IS will be detected relatively soon after establishment.

An important insight for early detection strategies is that the majority of U.S. counties experiencing high relative invasion pressure (Fig. 4E, 5) are located in metropolitan areas. In assessing the implications of this, it is necessary to realize that the term “metropolitan” is not synonymous with “urban” (at least in the U.S.) (Office of Information and Regulatory Affairs 2010). In U.S. metropolitan areas only 11% of the area is classified as developed land. Other land uses, such as forest, agriculture, and shrub/scrub account collectively for 70% of the land in metropolitan areas (Table A7 in Appendix). One key characteristic of metropolitan areas—the economic interactions between urban and rural areas—makes them a fertile ground for the establishment and spread of IS. Consequently, plant ecosystems within metropolitan areas that include hotspots are also under high relative invasion pressure.

From a research perspective there is a strong need to characterize in more detail the IS propagule pressure entering a country, i.e., what life stages are commonly associated with the uptake and transportation processes? Such an analysis could be conducted by combining a) high-resolution trade data (e.g., port to port), b) models developed to determine the location and extent of foreign regions that could potentially serve as the source of IS, and c) models for the growth and dispersion of IS around foreign logistic-network facilities (e.g., port terminals). The results of such analyses could then be applied at the release stage of the invasion model to determine the interacting mechanisms between IS biological traits and propagules that allow them to reach suitable habitats. In addition, further refinements are needed in the approach we used in our case study. For instance, we assumed that the origin of the imported live plants was near the place where the live plants were loaded into the containers (from a logistics perspective that assumption may make sense). However, implementing a probabilistic gravity model could account for the potential that other nearby ecological regions could be the source of the imports. Also, we assumed in our approach that IS potentially associated with live plants were due to infestations that occurred in the country of origin. However, we recognize that plants could become infested throughout the entire trade network, including when a container is opened at each port visited until the final destination is reached (Kaluza et al. 2010, Keller et al. 2010, Paini and Yemshanov 2012). Similarly, for the final destination of the imported live plants, we used information related to commercial business establishments in the U.S. that are involved in the sale of ornamental/nursery plants. However, as these relatively small commercial establishments keep losing market share to mass merchandisers and large home improvement stores, there will be a need to adjust our analytical approach.

From a policy perspective, there is a need to further develop strategies that more effectively acquire and incorporate trade information in pest risk analysis. We showed in our case study the importance of information such as daily port-to-port import data from all countries of the world to the United States that included the type of imported commodities. Such information may already exist (Sparka 2010) and it may already be available as a commercial database for selected countries (e.g., Piers® in our case study). Similarly, there is interest in developing early detection strategies that can help improve the decision processes regarding which IS to select for monitoring efforts. One way to improve the process would be to change the focus from individual pest species of concern to geographic areas or regions of concern. As stated above, areas with ecosystems under higher invasion pressure are likely to continue to be under higher invasion pressure in the future. Focusing surveillance efforts in such high-risk areas should increase the likelihood of early detection of IS (Colunga-Garcia et al. 2010b).

For the past few years the invasion literature has repeatedly noted the importance of global trade. Invasion ecologists can utilize a pathway centred conceptual model as described in the present paper as a framework to a) better understand the role of human-mediated pathways, b) enhance current methodologies for pest risk analysis, and c) develop strategies for IS early detection-rapid response programs.

Acknowledgements

We thank Eva Kassens-Noor, Janice Molloy, Trixie Smith, Wen Li, Robert Venette, and two anonymous reviewers for providing comments to enhance this manuscript. This project was made possible, in part, by a Cooperative Agreement from the United States Department of Agriculture’s Animal and Plant Health Inspection Service (APHIS) to the first author. The information and views set out in this paper are those of the authors and it may not necessarily express USDA-APHIS views.

References
Animal and Plant Health Protection Service (2007) Plant Inspection Station strategic plan 2007–2012. U.S. Department of Agriculture, Animal and Plant Health Inspection Service, Plant Protection and Quarantine, Washington, D.C., 1–24.
Animal and Plant Health Inspection Service (2011) Bulb Preclearance Program Identification Manual. U.S. Department of Agriculture, Animal and Plant Health Inspection Service, Plant Protection and Quarantine, Washington, D.C., 1–301.
Animal and Plant Health Inspection Service (2012a) Cut Flowers and Greenery Import Manual. U.S. Department of Agriculture, Animal and Plant Health Inspection Service, Plant Protection and Quarantine, Washington, D.C., 1–156.
Animal and Plant Health Inspection Service (2012b) Plants for Planting Manual. U.S. Department of Agriculture, Animal and Plant Health Inspection Service, Plant Protection and Quarantine, Washington, D.C., 1–620.
Anselin L (1995) Local indicators of spatial association - LISA. Geographical Analysis 27: 93-115. doi: 10.1111/j.1538-4632.1995.tb00338.x
Anselin L, Syabri I, Kho Y (2006) GeoDa: An introduction to spatial data analysis. Geographical Analysis 38: 5-22. doi: 10.1111/j.0016-7363.2005.00671.x
Aukema JE, Leung B, Kovacs K, Chivers C, Britton KO, Englin J, Frankel SJ, Haight RG, Holmes TP, Liebhold AM, McCullough DG, Von Holle B (2011) Economic impacts of non-native forest insects in the continental United States. PLoS ONE 6: 1–7. e24587. doi: 10.1371/journal.pone.0024587
Bradley BA, Blumenthal DM, Early R, Grosholz ED, Lawler JJ, Miller LP, Sorte CJB, CM D’Antonio, Diez JM, Dukes JS, Ibanez I, Olden JD (2012) Global change, global trade, and the next wave of plant invasions. Frontiers in Ecology and the Environment 10: 20-28. doi: 10.1890/110145
Brasier CM (2008) The biosecurity threat to the UK and global environment from international trade in plants. Plant Pathology 57: 792-808. doi: 10.1111/j.1365-3059.2008.01886.x
Britton KO, White P, Kramer A, Hudler G (2010) A new approach to stopping the spread of invasive insects and pathogens: early detection and rapid response via a global network of sentinel plantings. New Zealand Journal of Forestry Science 40: 109-114.
Colunga-Garcia M, Magarey RA, Haack RA, Gage SH, Qi J (2010a) Enhancing early detection of exotic pests in agricultural and forest ecosystems using an urban-rural gradient framework. Ecological Applications 20: 303-310. doi: 10.1890/09-0193.1
Colunga-Garcia M, Haack RA, Magarey RA, Margosian ML (2010b) Modeling spatial establishment patterns of exotic forest insects in urban areas in relation to tree cover and propagule pressure. Journal of Economic Entomology 103: 108-118. doi: 10.1603/EC09203
Davis MA (2009) Invasion biology. Oxford University Press, New York, 1–244.
di Castri F (1989) History of biological invasions with special emphasis on the old world. In: Drake JA, Mooney HA, di Castri F, Groves RH, Kruger FJ, Rejmanek M, Williamson M (Eds) Biological invasions: a global perspective. John Wiley, Chichester, UK: 1-30.
Drew J, Anderson N, Andow D (2010) Conundrums of a complex vector for invasive species control: a detailed examination of the horticultural industry. Biological Invasions 12: 2837-2851. doi: 10.1007/s10530-010-9689-8
Fortin M, Dale M (2005) Spatial analysis: a guide for ecologists. Cambridge University Press, Cambridge, United Kingdom, 1–365.
Hulme PE (2009) Trade, transport and trouble: managing invasive species pathways in an era of globalization. Journal of Applied Ecology 46: 10-18. doi: 10.1111/j.1365-2664.2008.01600.x
International Plant Protection Convention (2009) International standards for phytosanitary measures: ISPM No. 32. Categorization of commodities to their pest risk. Food and Agriculture Organization of the United Nations, Rome, Italy, 1–16.
International Plant Protection Convention (2012a) International standards for phytosanitary measures: ISPM No. 5. Glossary of phytosanitary terms. Food and Agriculture Organization of the United Nations, Rome, Italy, 1–38.
International Plant Protection Convention (2012b) International Standards for Phytosanitary Measures: ISPM No. 36. Integrated measures for plants for planting. Food and Agriculture Organization of the United Nations, Rome, Italy, 1–20.
Kaluza P, Kölzsch A, Gastner MT, Blasius B (2010) The complex network of global cargo ship movements. Journal of the Royal Society Interface 7: 1093-1103 doi: 10.1098/rsif.2009.0495
Keller RP, Drake JM, Drew MB, Lodge DM (2010) Linking environmental conditions and ship movements to estimate invasive species transport across the global shipping network. Diversity and Distributions 17: 93-102. doi: 10.1111/j.1472-4642.2010.00696.x
Liebhold AM, Brockerhoff EG, Garrett LJ, Parke JL, Britton KO (2012) Live plant imports: The major pathway for forest insect and pathogen invasions of the United States. Frontiers in Ecology and the Environment 10: 135-143. doi: 10.1890/110198
Lonsdale WM (1999) Global patterns of plant invasions and the concept of invasibility. Ecology 80: 1522-1536. doi: 10.1890/0012-9658(1999)080[1522:GPOPIA]2.0.CO;2
Lugo AE, Gonzalez G (2010) Changing conditions and changing ecosystems: A long-term regional and transcontinental research approach on invasive species. In: Dix ME, Britton K (Eds) A dynamic invasive species research vision: opportunities and priorities 2009–29. Gen. Tech. Rep. WO-79/83. U.S. Department of Agriculture, Forest Service, Research and Development, Washington, D.C., 121-126.
Magarey RD, Colunga-Garcia M, Fieselmann DA (2009) Plant biosecurity in the United States: roles, responsibilities and information needs. BioScience 59: 875-884. doi: 10.1525/bio.2009.59.10.9
Mehta SV, Haight RG, Homans FR, Polasky S, Venette RC (2007) Optimal detection and control strategies for invasive species management. Ecological Economics 61: 237-245. doi: 10.1016/j.ecolecon.2006.10.024
Meyerson LA, Mooney HA (2007) Invasive alien species in an era of globalization. Frontiers in Ecology and the Environment 5: 199-208. doi: 10.1890/1540-9295(2007)5[199:IASIAE]2.0.CO;2
National Invasive Species Council (2003) General guidelines for the establishment and evaluation of invasive species early detection and rapid response systems Version 1. U.S. Department of the Interior, Office of the Secretary, Washington, D.C., 1–16.
Office of Information and Regulatory Affairs (2010) 2010 standards for delineating metropolitan and micropolitan statistical areas. U.S. Office of Management and Budget. Federal Register 75: 123 (28 June 2010), 37246–37252.
Olson DM, Dinerstein E, Wikramanayake ED, Burgess ND, Powell GVN, Underwood EC, D’Amico JA, Itoua I, Strand HE, Morrison JC, Loucks CJ, Allnutt TF, Ricketts TH, Kura Y, Lamoreux JF, Wettengel WW, Hedao P, Kassem KR (2001) Terrestrial ecoregions of the world: a new map of life on Earth. BioScience 51: 933-938. doi: 10.1641/0006-3568(2001)051[0933:TEOTWA]2.0.CO;2
Paini DR, Yemshanov D (2012) Modelling the arrival of invasive organisms via the international marine shipping network: A Khapra beetle study. PLoS ONE 7: 1–9. e44589. doi: 10.1371/journal.pone.0044589
Parke JL, Grünwald NJ (2012) A systems approach for management of pests and pathogens of nursery crops. Plant Disease 96: 1236-1244. doi: 10.1094/PDIS-11-11-0986-FE
Pejchar L, Mooney HA (2009) Invasive species, ecosystem services and human well-being. Trends in Ecology and Evolution 24: 497-504. doi: 10.1016/j.bbr.2011.03.031
Perrings C, Fenichel E, Kinzig A (2009) Globalization and invasive alien species: trade, pests, and pathogens. In: Perrings C, Mooney H, Williamson M (Eds) Bioinvasions and Globalization: Ecology, Economics, Management, and Policy. Oxford University Press, Oxford, 42-55. doi: 10.1093/acprof:oso/9780199560158.003.0004
Pimentel D (2009) Invasive plants: their role in species extinctions and economic losses to agriculture in the USA. In: Inderjit (Ed) Management of invasive weeds. Springer Science + Business Media B.V., Netherlands, 1-7.
Pyšek P, Richardson DM (2010) Invasive Species, Environmental Change and Management, and Health. Annual Review of Environment and Resources 35: 25-55. doi: 10.1146/annurev-environ-033009-095548
Rabaglia RJ, Duerr D, Acciavatti R, Ragenovich I (2008) Early detection and rapid response for non-native bark and Ambrosia beetles. USDA Forest Service, Forest Health Protection, Washington, D.C., 1–12.
Reichard SH, White P (2001) Horticulture as a pathway of invasive plant introductions in the United States. BioScience 51: 103-113. doi: 10.1641/0006-3568(2001)051[0103:HAAPOI]2.0.CO;2
Scalera R (2010) How much is Europe spending on invasive alien species? Biological Invasions 12: 173–177. doi: 10.1007/s10530-009-9440-5
Simberloff D (2009) The role of propagule pressure in biological invasion. Annual Review of Ecology, Evolution, and Systematics 40: 81-102. doi: 10.1146/annurev.ecolsys.110308.120304
Simpson A, Jarnevich C, Madsen J, Westbrooks R, Fournier C, Mehrhoff L, Browne M, Graham J, Sellers E (2009) Invasive species information networks: collaboration at multiple scales for prevention, early detection, and rapid response to invasive alien species. Biodiversity 10: 5-13. doi: 10.1080/14888386.2009.9712839
Sparka F (2010) Jurisdiction and arbitration clauses in maritime transport documents: A comparative analysis. Springer-Verlag, Berlin, Heidelberg, 1–281.
Vilà M, Basnou C, Pysvek P, Josefsson M, Genovesi P, Gollasch S, Nentwig W, Olenin S, Roques A, Roy D, Hulme PE, DAISIE partners (2010) How well do we understand the impacts of alien species on ecosystem services? A pan-European, cross-taxa assessment. Frontiers in Ecology and the Environment 8: 135-144. doi: 10.1890/080083
Waterman J (2102) Drying up: Consumers will seek out bargains from mass retailers, hurting traditional nurseries. IBISWorld Industry Report 44422 Nursery & Garden Stores in the US, 1–27.
Westphal MI, Browne M, MacKinnon K, Noble I (2008) The link between international trade and the global distribution of invasive alien species. Biological Invasions 10: 391-398. doi: 10.1007/s10530-007-9138-5
Williamson M (1996) Biological invasions. Chapman and Hall, London, UK, 1–244.
World Trade Organization (2010) The WTO Agreements Series Sanitary and Phytosanitary Measures. World Trade Organization, Switzerland, 1–45.
Ziska LH, Blumenthal DM, Runion GB, Hunt Jr ER, Diaz-Soltero H (2010) Invasive species and climate change: an agronomic perspective. Climatic Change 105: 13-42. doi: 10.1007/s10584-010-9879-5
Appendix

Global trade and invasion pressure in plant ecosystems: Supplementary figures and tables. (doi: 10.3897/neobiota.18.4019.app1) File format: Acrobat Adobe document (pdf).

Explanation note: Worldwide annual value (USD) for four categories of live plant imports from 2001-2011 (Fig. A1). Top 10 world exporting (Table A1) and importing (Table A2) countries of live plants in 2011. Value of U.S. live plant imports from all world regions except NAFTA (Mexico and Canada) (Table A3) and from the NAFTA region only (Table A4). Characterization of U.S. counties with agricultural (Table A5) and forest (Table A6) land use that were a potential destination of maritime containerized imports of live plants in 2010. Percentage of land use/cover types in the metropolitan areas of the U.S. (Table A7).