


(C) 2013 David C. Cook. This is an open access article distributed under the terms of the Creative Commons Attribution License 3.0 (CC-BY), which permits unrestricted use, distribution, and reproduction in any medium, provided the original author and source are credited.
For reference, use of the paginated PDF or printed version of this article is recommended.
Citation: Cook DC, Liu S, Edwards J, Villalta ON, Aurambout J-P, Kriticos DJ, Drenth A, De Barro PJ (2013) An assessment of the benefits of yellow Sigatoka (Mycosphaerella musicola) control in the Queensland Northern Banana Pest Quarantine Area. In: Kriticos DJ, Venette RC (Eds) Advancing risk assessment models to address climate change, economics and uncertainty. NeoBiota 18: 67–81. doi: 10.3897/neobiota.18.3863
The banana leaf spotting disease yellow Sigatoka is established and actively controlled in Australia through intensive chemical treatments and diseased leaf removal. In the State of Queensland, the State government imposes standards for de-leafing to minimise the risk of the disease spreading in 6 banana pest quarantine areas. Of these, the Northern Banana Pest Quarantine Area is the most significant in terms of banana production. Previous regulations imposed obligations on owners of banana plants within this area to remove leaves from plants with visible spotting on more than 15 per cent of any leaf during the wet season. Recently, this leaf disease threshold has been lowered to 5 per cent. In this paper we examine the likely impact this more-costly regulation will have on the spread of the disease. We estimate that the average net benefit of reducing the diseased leaf threshold is only likely to be $1.4 million per year over the next 30 years, expressed as the annualised present value of tightened regulation. This result varies substantially when the timeframe of the analysis is changed, with shorter time frames indicating poorer net returns from the change in protocols. Overall, the benefit of the regulation change is likely to be minor.
Biosecurity, invasive alien species, banana pathogen, yellow Sigatoka
The Sigatoka disease complex affects banana cultivation in many countries. The disease yellow Sigatoka (Mycosphaerella musicola) is established and actively controlled in Australia through intensive fungicide treatments and diseased leaf removal (
In all areas of the State where Mycosphaerella musicola occurs, grower costs are incurred through compliance with government-imposed standards for de-leafing to minimise the risk of the disease’s spread. The Plant Protection Regulation 2002 was put in place under the Plant Protection Act 1989 which defined 6 banana pest quarantine areas (State of Queensland 2002). Of these, the Northern Banana Pest Quarantine Area (NBPQA) is the most significant, encompassing over 80 per cent of the State’s banana production. The Plant Protection Regulation 2002 imposed an obligation on the owner of land in a pest quarantine area to treat every banana plant by removing every leaf from the plant that has visible symptoms of Mycosphaerella musicola (and another endemic disease, banana leaf speckle (Mycosphaerella musae)) on more than 15 per cent of any leaf at any time between 1 November and 31 May or on more than 30 per cent of any leaf at any time between 1 June and 31 October.
An amendment to the Plant Protection Regulation 2002, the Plant Protection Amendment Regulation (No. 4) 2003, was subsequently put in place in response to concerns that the de-leafing standards initially imposed were too permissive. In particular, during wet season conditions in the NBPQA the 15 per cent de-leafing threshold was deemed insufficient to prevent Mycosphaerella musicola and Mycosphaerella musae from spreading. Moreover, the 30 per cent action level in the dry season was thought to be far too high for wet weather conditions highly conducive to disease spread (State of Queensland 2003). The Amendment imposed a lower threshold of 5 per cent throughout the year in the NBPQA.
As deleterious as these amended regulations appear to be in terms of the foliage carried by commercial banana plants, the impact on production volume is likely to be minimal. During their life, individual banana plants may produce 30 or more leaves, which is surplus to their phosynthetic needs. The oldest leaves are shed at a rate of approximately 1 leaf every 10 to 12 days so that when the fruit bunch emerges from the top of the pseudostem the plant has an average of 15 leaves. After the bunch shoots no new leaves are produced. The oldest leaves of the plant continue to fall until, at harvest, between 6 and 8 leaves remain (
While the incidence of leaf disease is likely to be reduced if stricter thresholds are implemented and maintained over time, additional costs to banana growers in the NBPQA will apply. These include substantial increases in chemical treatment and application costs in addition to more rigorous de-leafing cycles. In this paper we estimate the likely change in net returns to the banana industry in the NBPQA from adopting the new 5 per cent de-leafing threshold.
The stochastic simulation model used in this assessment determines total expected (or probability-weighted) damage from Mycosphaerella musicola in the NBPQA over a 30-year period under both a 15 per cent and a 5 per cent de-leafing threshold. Uncertain or variable parameters are specified as probability distributions. 10 000 model iterations are run using values randomly sampled across the range of each distribution using a Latin hypercube sampling algorithm.
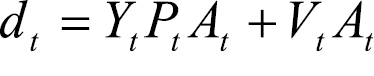
The total damage banana producers in the NAPQA experience because of the disease in time period t (dt) is estimated by:
 (1)
(1)
where: Yt is the mean change in banana yield resulting from infection (assumed 100 per cent) in year t; Pt is the prevailing domestic price for bananas in year t; Vt is the increase in variable cost of production per hectare induced by Mycosphaerella musicola on-plantation management methods in year t; and At is the area infected with Mycosphaerella musicola in year t.
A stratified diffusion model combining both short and long distance dispersal processes is used to predict At. Parameter estimates for this model appear in Table 1, and are explained below.
Parameter values
| Description | 15% de-leafing threshold | 5% de-leafing threshold |
|---|---|---|
| Detection probability (%). | 100 | 100 |
| Infection diffusion coefficient, D (m2/yr). |
Pert(2.0×10³, 3.5×10³, 5.0×10³) | Pert(0.0, 1.0×10², 2.0×10²) |
| Percentage of total NBPQA plantation area infected in the first time step (%). |
Pert(0.0, 1.5, 3.0) | Pert(0, 2, 4) |
| Minimum area infected, Amin (m2). | 1.0×10³ | 1.0×10³ |
| Maximum area infected, Amax (m2). |
9.8×10⁷ | 9.8×10⁷ |
| Intrinsic rate of infection and density increase, r(yr-1). |
Pert (0.00, 0.01, 0.02) | Pert (0.00, 0.01, 0.02) |
| Minimum infection density, Nmin (#/m2). | 1.0×10⁻⁴ | 1.0×10⁻⁴ |
| Maximum infection density, K (#/m2). |
Pert(100, 550, 1000) | Pert(100, 550, 1000) |
| Minimum number of satellite sites generated in a single time step, Smin (#). | 1 | 1 |
| Maximum number of satellite sites generated in a single time step, Smax (#). |
Pert(0, 5, 10) | Pert(0, 5, 10) |
| Intrinsic rate of new foci generation per unit area of infection, µ (#/m2). |
Pert(1.0×10⁻², 3.0×10⁻², 5.0×10⁻²) | Pert(1.0×10⁻², 3.0×10⁻², 5.0×10⁻²) |
| Demand elasticity. |
Uniform(-1.1, -1.0) | Uniform(-1.1, -1.0) |
| Prevailing market price of bananas in the first time step ($/T). |
1 900 | 1 900 |
| Maximum area considered for eradication, Aerad (ha). | 0 | 0 |
| Treatment costs upon detection – chemical ($/ha). |
Pert(8.0×10³, 1.1×10⁴, 1.3×10⁴) | Pert(1.6×10⁴, 5.0×10⁴, 6.6×10⁴) |
| Treatment costs upon detection – de-leafing ($/ha). |
Pert(1.4×10³, 2.1×10³, 2.8×10³) | Pert(2.1×10³, 3.1×10³, 3.2×10³) |
| Yield reduction despite control(%). | Pert(0.0, 2.5, 5.0) | Pert(0.0, 0.5, 1.0) |
| Discount rate (%). |
5 | 5 |
† Specified with reference to
‡ Derived from
§
|
¶Assumes: (i) average density of planting of 2 000 stems/ha and removal, (ii) control of Mycosphaerella musicola in the NBPQA involves applications of dithane (at 3kg/ha or $21.60/ha) and oil (at 3L/ha or $8.85/ha) at weekly intervals during the wet season (
# De-leafing plantations to control Mycosphaerella musicola to a 15% threshold occurs up to 15 times per season. Assume an additional 5 to 10 de-leafing cycles are necessary to achieve a 5% threshold at a cost of $140/ha each.
††
Note that due to the uncertainty surrounding some of these parameters, they are specified using a range of distributional forms, rather than simple point estimates. Types of distributions used in the table include: (a) pert – a type of beta distribution specified using minimum, most likely (or skewness) and maximum values often preferred when parameters are reliant a number of sources (or expert opinions) since the mean is relatively insensitive to minimum and maximum values compared to the most likely value; (b) uniform – a rectangular distribution bounded by minimum and maximum values used to highlight the fact that there is little known about a parameter (
The dispersal model is derived from the reaction diffusion models originally developed by 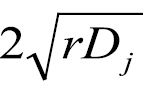 in all directions, where r describes a growth factor for Mycosphaerella musicola per year in the NBPQA (assumed constant over all infected sites) and Dj is a diffusion coefficient for an infected site with an age index j (indicating the time step in which the site was originally formed) in the NBPQA (
 . (2)
. (2)
We assume Dj is constant across all sites with an age index j, so ignore demographic stochasticity and consequent non-uniform invasion. Since the two control strategies we are considering (i.e. 5 per cent and 15 per cent de-leafing regulations) are very similar, many of the parameters remain the same for both scenarios. But, D is assumed to be lower under the 5 per cent de-leafing threshold due to increased chemical suppression limiting local dispersal opportunities for the disease.
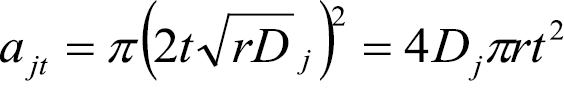
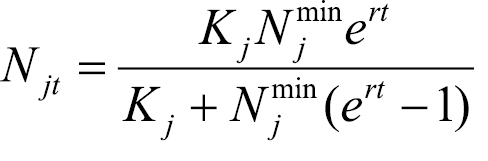
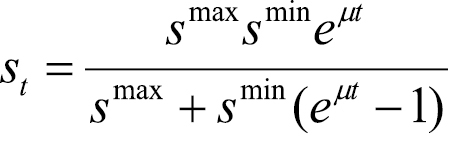
The density of Mycosphaerella musicola infection within ajt influences the control measures required to counter the effects of infection and thus partially determines the value of At. We assume that within each site with age index j affected, the infection density, Njt, grows over time period t following a logistic growth curve until the carrying capacity of the host environment, Kj, is reached:
 . (3)
. (3)
Here, Njmin is the size of the original infection at site with age index j and r is the intrinsic rate of density increase (assumed to be the same as the intrinsic rate of infection increase) (
 (4)
(4)
where μ is the intrinsic rate of new foci generation (assumed constant over time) and smin is the minimum number of satellite sites generated.
Given equations (1)-(4), we can express At as:
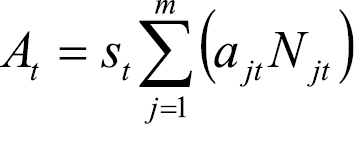 where
where 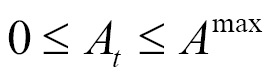 . (5)
. (5)
Spread area, infection density and the number of foci are combined with the probability of entry and establishment in an expression of probability-weighted, or expected damage over time. Assuming a discount rate δ, the present value of expected damage after t time periods (TCP) is:
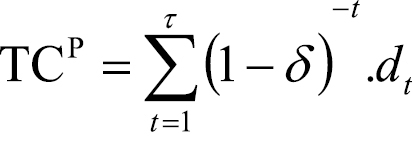 . (6)
. (6)
This expression provides us with an estimate of infection-induced producer losses over time. It therefore provides an indication of the economic significance of Mycosphaerella musicola over time given a de-leafing protocol. If we denote the total expected damage under a 15 per cent and a 5 per cent de-leafing protocol TCP15% and TCP5%, respectively, we can determine the likely change in expected damage (ΔTCP) from adopting the new 5 per cent protocol as:
 . (7)
. (7)
If indeed the 5 per cent de-leafing protocol is more effective than the previous 15 per cent protocol at reducing Mycosphaerella musicola prevalence and impact over time, we would expect ΔTCP>0.
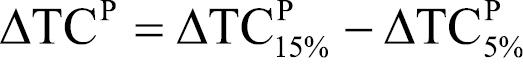
Mycosphaerella musicola is assumed to be present within the NBPQA at the beginning of time period 1. Therefore, the resultant expected spread area values calculated from 10 000 iterations of the model are positive, as revealed by Figure 1. Spread is predicted to be very slow in both the 5 per cent and 15 per cent de-leafing protocol scenarios due to the effectiveness of chemical and de-leafing treatments applied simultaneously. The box-whisker plot used in this Figure (and in Figures 2 to 4 to follow) shows the extent of uncertainty in the model predictions dictated by the uncertainty in parameter specification. The box-whisker plot shows the 25th percentile of the frequency distribution of model outcomes, the median (i.e. the 50th percentile), the 75th percentile and remaining values up to and including the 5th and 95th percentiles of the frequency distribution of model outcomes.
Expected area of commercial banana plantations affected by yellow Sigatoka in Australia under different management guidelines.
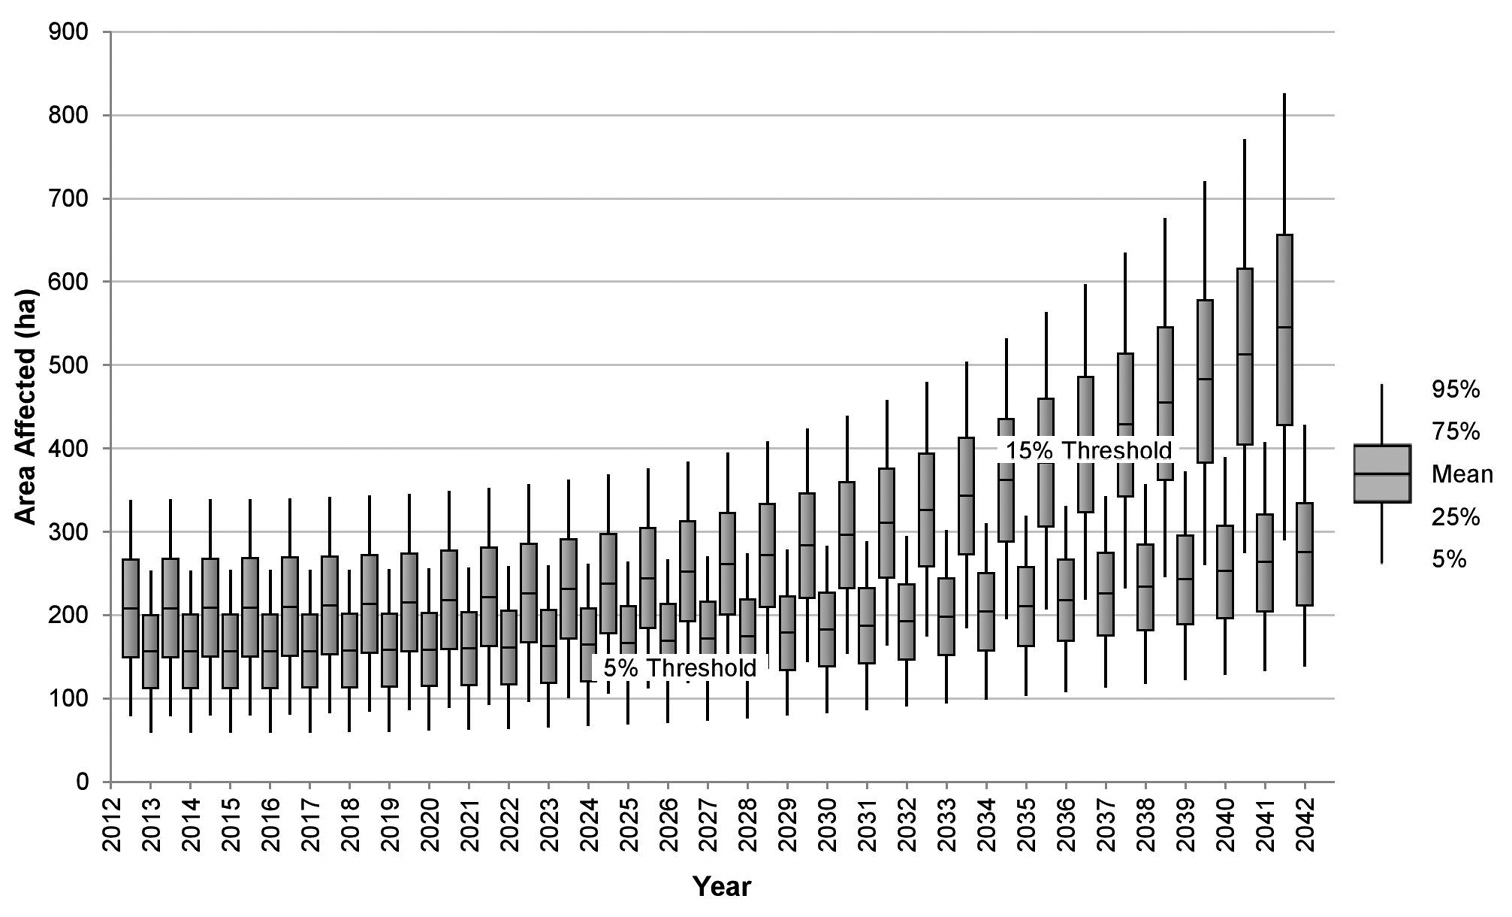
Predicted industry losses from yellow Sigatoka in Australia under different management guidelines.
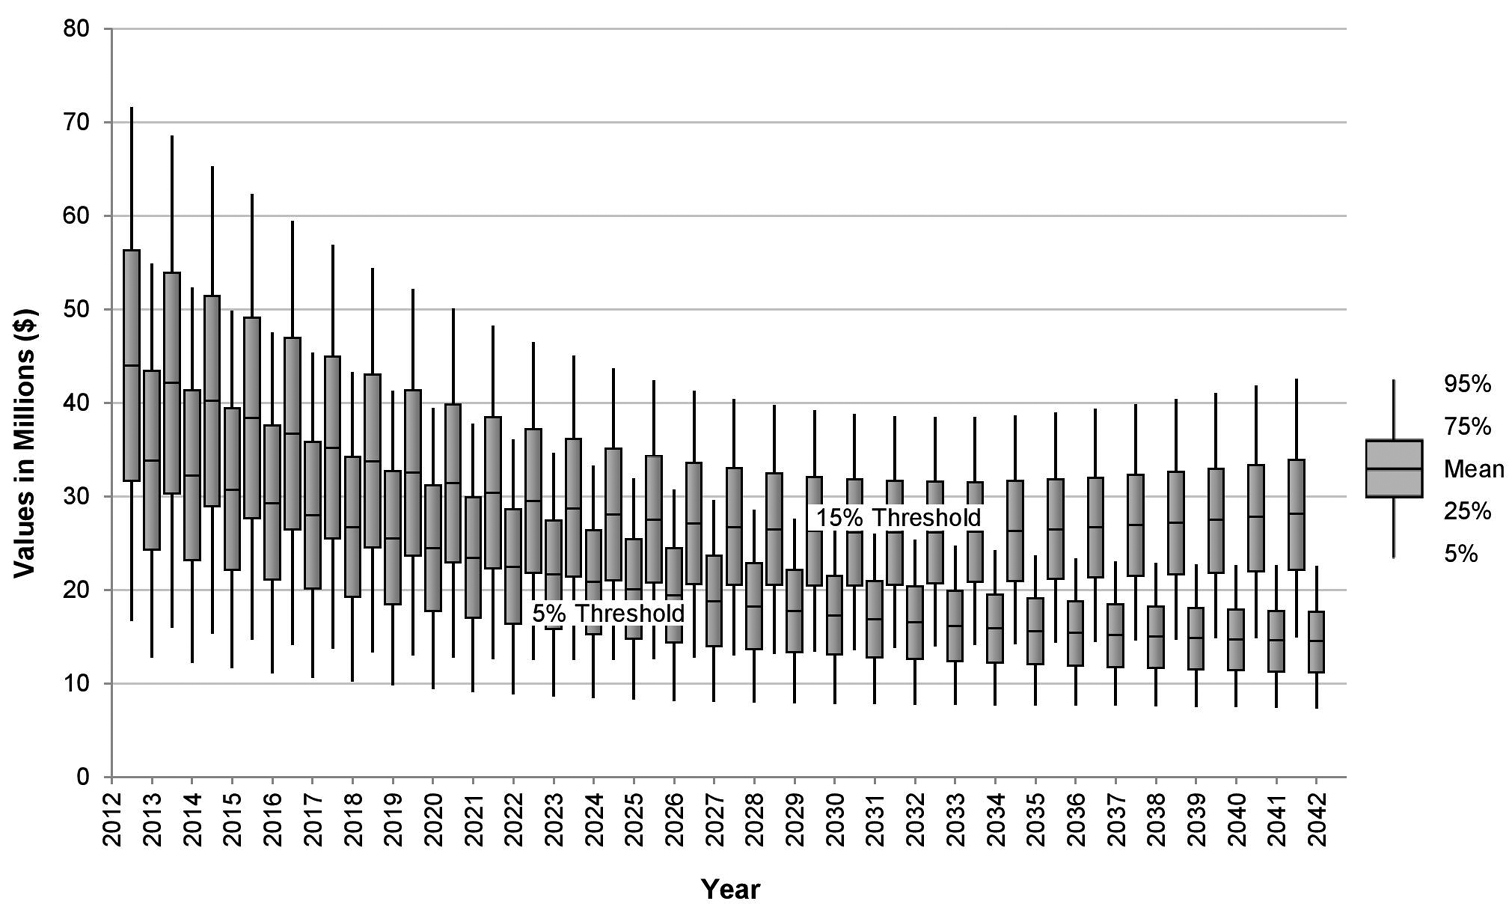
Predicted gross benefit of adopting a 5 per cent de-leafing threshold for yellow Sigatoka suppression in the NBPQA relative to a 15 per cent protocol.
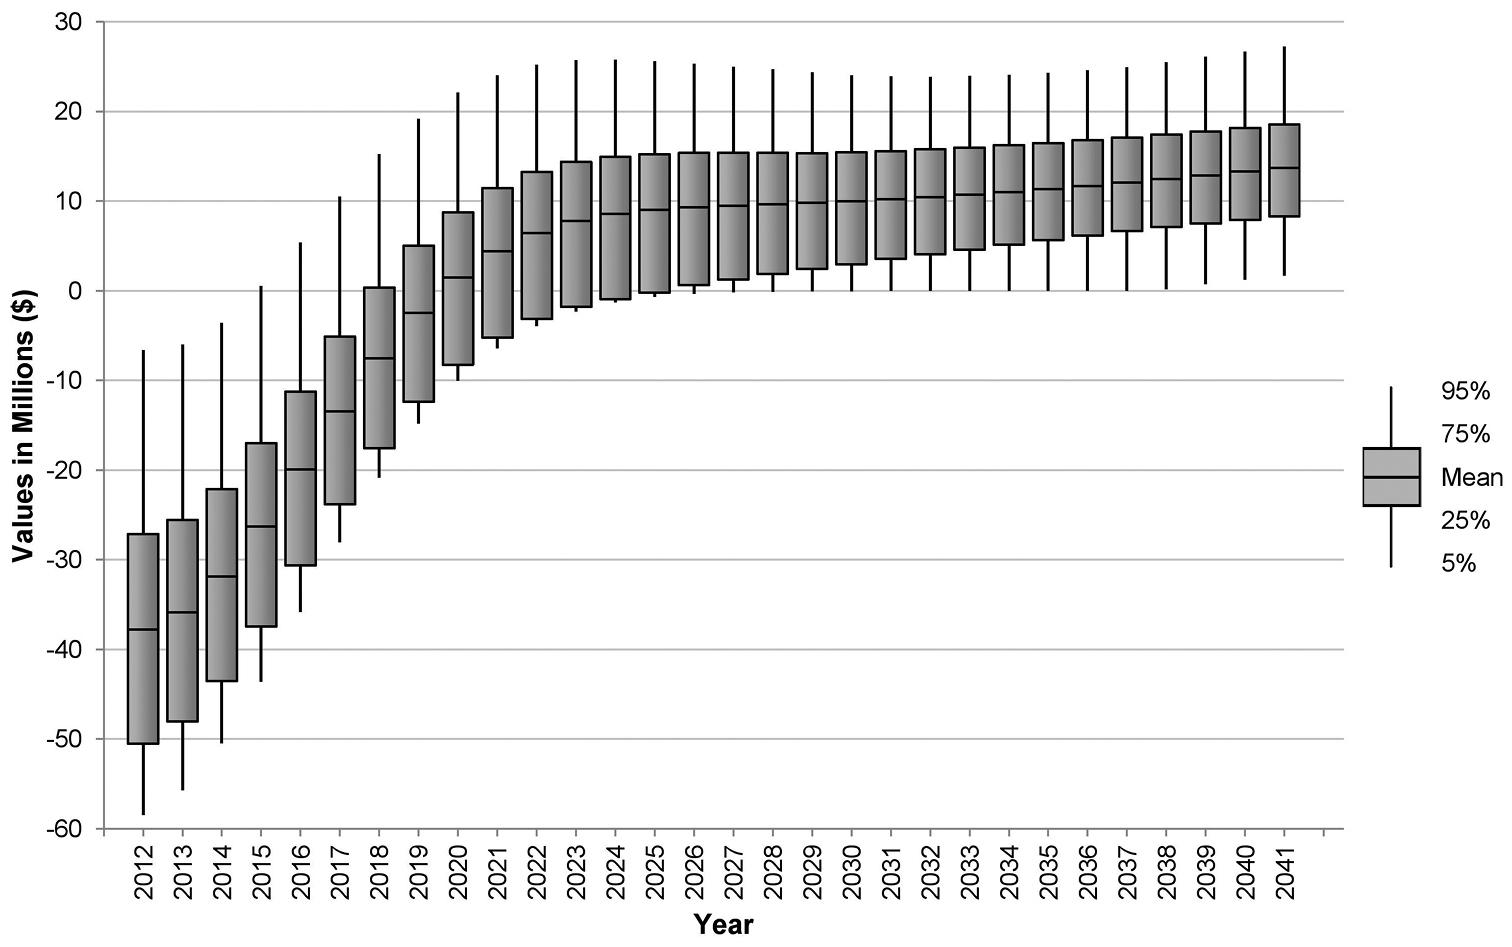
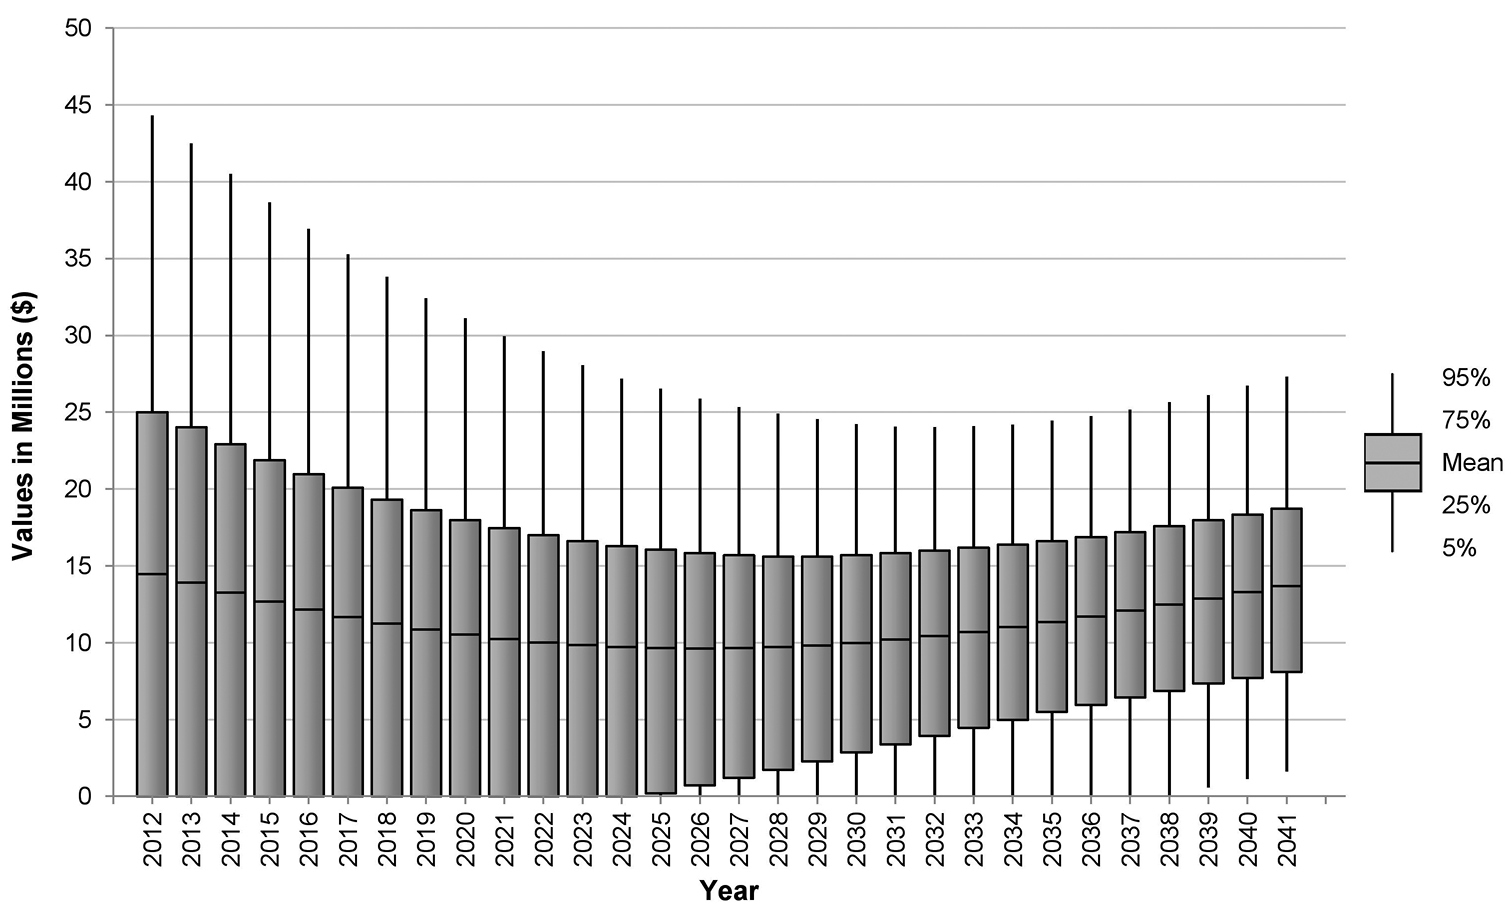
Predicted net benefit of adopting a 5 per cent de-leafing threshold for yellow Sigatoka suppression in the NBPQA relative to a 15 per cent protocol.
Figure 2 illustrates how the resultant TCP15% and TCP5% (i.e. see equation (6)) are expected to change over the 30-year period of the simulation. Here, the mean values of TCP15% and TCP5% predicted by the model in each year are plotted with 10th and 50th percentiles of the frequency distribution of model outcomes. All projected costs are discounted at 5 per cent per annum. By the 30th year, TCP15% is expected to average just under $30 million per year, and TCP5% just under $15 million per year.
Note that despite the area affected by the disease remaining relatively constant in both control scenarios, the erosive effects of the discount rate lead to a gradual decline in present value of future expected annual industry damage.
Figure 3 illustrates how the difference between TCP15% and TCP5% (i.e. ΔTCP in equation (7)) is expected to change over time, and therefore the relative merit in the banana industry choosing a 5 per cent de-leafing protocol over a 15 per cent protocol in the NBPQA. Over the 30 years simulated by the mode, the annualised present value of benefit to producers is $11.3 million. But, as Figure 3 shows there is a large amount of uncertainty associated with predicting this far into the future (i.e. the standard deviation of the benefit estimate is $9.3 million).
Economic research in the area of invasive species has grown substantially in the last 20 years from a modest base (
In contrast, the predictive model presented in this paper provides a more open and transparent means of summarising complex interactions between natural processes and land managers over time for a policy audience. Policy-makers face a difficult challenge because invasive species impacts change with respect to time, space and other variables in ways that are difficult to predict (
Several studies have integrated established ecological models (including reaction-diffusion, stratified diffusion and predator-prey models) with economic management frameworks for invasive species using comparable approaches (
At the cost of not producing spatially explicit outputs, our model provides a more accurate estimation of the economic impacts of invasive species by incorporating partial equilibrium models. This approach allows a detailed examination of changes in producer (and consumer) welfare in domestic (e.g.
Similar problems arise with partial equilibrium models due to their aggregated and compact nature, and their integration with ecological spread requires the use of exogenous assumptions regarding the effect that an invasive species will have on the supply curve of the host commodity (
(i) An average density of planting of 2 000 stems per hectare and removal;
(ii) Control of Mycosphaerella musicola in the NBPQA involves applications of dithane (at 3 kg per hectare or $22 per hectare) and oil (at 3 L per hectare or approximately $9 per hectare) at weekly intervals during the wet season (
(iii) Growers rotate the use of dithane and oil with propiconazole (at 0.3 L per hectare or $22 per hectare) to manage resistance (
(iv) 15 to 25 cycles of fungicides are used for control of Mycosphaerella musicola in the NBPQA to comply with a 15 per cent de-leafing threshold, and an additional 5 to 10 spray cycles are needed to comply with a 5 per cent de-leafing threshold;
(v) De-leafing plantations to control Mycosphaerella musicola to a 15 per cent threshold occurs up to 15 times per season, and an additional 5 to 10 de-leafing periods are necessary to achieve a 5 per cent threshold at a cost of $140 per hectare each.
Extrapolating across the entire NBPQA, these assumptions imply that producer costs will rise by approximately $43.8 million under the 5 per cent de-leafing threshold (Table 2). This includes both de-leafing and chemical application costs required in areas affected by Mycosphaerella musicola. Since the market is closed to imports, the domestic price of bananas will increase as producers pass these cost increases on to consumers. The extent of the price change is predicted in the model using the elasticity of demand (i.e. the ratio of percentage quantity changes over percentage price changes). Thus, our producer behavioural assumptions combine with the spread model to simulate changes in the market over time.
Annualised cost of adopting a 5 per cent de-leafing threshold for yellow Sigatoka suppression in the NBPQA relative to a 15 per cent protocol aggregated across the region.
| Description | 15% de-leafing threshold (A) | 5% de-leafing threshold (B) | B-A |
|---|---|---|---|
| Chemical treatment costs ($ million) | 115.4 | 146.1 | 31.3 |
| De-leafing costs ($ million) | 19.6 | 32.0 | 12.5 |
| Total ($ million) | 134.9 | 178.7 | 43.8 |
Note that the costs indicated in Table 2 are annualised average costs estimated across the whole NBPQA attributable to compliance with the leaf disease thresholds. The right hand column labelled B-A represents the annualised increase in chemical and de-leafing costs imposed by the lower threshold of 5 per cent. By comparing the present value (i.e. the discounted or real) value of these annual cost increments to the predicted benefits derived from Figure 3, we can estimate the likely change in netreturns (i.e. benefits minus costs) to the NBPQA from adopting this lower standard.
While Table 2 summarises our analysis, it does not show the extent to which likely net benefits change depending on the time frame of the analysis. Net returns on a year-by-year basis are shown in Figure 4, which reveals the full extent of uncertainty surrounding possible net returns to the region in each time step. Initially, due to the increased cost of compliance to the 5 per cent leaf disease threshold, net costs (i.e. a surplus of costs over benefits) are likely to result in the short term. However, after a period of time (between 7 and 14 years) the benefits generated by lower Mycosphaerella musicola prevalence and impact begin to outweigh compliance costs. By the end of the simulation period, net benefits are likely to be over $13 million per annum.
On average, over the 30-year model simulation period, the annualised present value of net benefit to the banana industry in the NBPQA from the adoption of the more stringent leaf disease threshold is estimated to be $1.4 million. Considering this benefit accrues over an area of approximately 10 100 hectares, the impact of the change in disease thresholds appears to be marginal. If we calculate average net returns over a 20-year period, we find that a net cost of the order of -$3.4 million per annum is likely to result. As Figure 4 clearly shows, this is due to the large net costs concentrated in the early years of adopting the new threshold. The further forward in time we project, the larger the likely returns to the banana industry of imposing the stricter leaf disease threshold.
Given the intertemporal nature of cost accrual, our model clearly communicates the importance of the timeframe being considered for a policy choice to decision-makers. Assuming they prefer to consider a 30-year time period, the annualised average present value of benefits expected to result from tightening the de-leafing threshold is likely to be small, but positive. Shorter time frames suggest the net benefits will be smaller, and (if less than a 10-year time frame is considered) possibly negative. We should also point out that if decision-makers apply a higher (personal) discount rate of 10 per cent to the mean or average model calculations, as opposed to a public/social discount rate of 5 per cent, the mean net benefit to the banana industry would fall to -$1.6 million over 30 years. This highlights the importance of both the choice of time frame and the choice of discount rate.
While the modelling framework we have developed provides a solid foundation over which other comprehensive economic analyses of invasive species effects can be performed, future extensions to the model may be warranted in some situations. These could include the adoption of an ecosystems approach within the bioeconomic model to capture interactions between invasive and native species (
In a plant biosecurity context, it is often difficult to predict policy benefits over time due to complex biophysical interactions between invasive species, their hosts and the environment. In this paper, we have demonstrated how a bioeconomic analysis can help decision-makers using the example of Mycosphaerella musicola. We have developed an analytical approach using a stratified diffusion spread model to simulate the likely benefits of adopting a 5 per cent de-leafing threshold for Mycosphaerella musicola suppression in the NBPQA relative to a 15 per cent protocol. Using Monte Carlo simulation to generate a range of possible incursion scenarios over a 30-year time period, we predict that in an average year this new protocol will only reduce the net impact of the disease by $1.4 million. However, this result varies substantially depending on the timeframe over which benefits and costs are projected, with shorter time frames indicating poorer net returns from the change in protocols. Compounding this issue is the uncertainty involved in predicting policy impacts further into the future. It is therefore difficult to evaluate the 5 per cent de-leafing protocol. But, if we take the 30-year timeframe presented in our analysis as a guide, the effects of the policy are likely to be positive, but relatively minor.
The authors would like to acknowledge the support of the Australian Plant Biosecurity Cooperative Research Centre, established and supported under the Australian Government’s Cooperative Research Centres Program. We would also like to thank two anonymous reviewers for their helpful comments on the paper.