


(C) 2013 Richard H.A. Baker. This is an open access article distributed under the terms of the Creative Commons Attribution License 3.0 (CC-BY), which permits unrestricted use, distribution, and reproduction in any medium, provided the original author and source are credited.
For reference, use of the paginated PDF or printed version of this article is recommended.
Citation: Baker RHA, Eyre D, Brunel S (2013) Matching methods to produce maps for pest risk analysis to resources. In: Kriticos DJ, Venette RC (Eds) Advancing risk assessment models to address climate change, economics and uncertainty. NeoBiota 18: 25–40. doi: 10.3897/neobiota.18.4056
Decision support systems (DSSs) for pest risk mapping are invaluable for guiding pest risk analysts seeking to add maps to pest risk analyses (PRAs). Maps can help identify the area of potential establishment, the area at highest risk and the endangered area for alien plant pests. However, the production of detailed pest risk maps may require considerable time and resources and it is important to match the methods employed to the priority, time and detail required. In this paper, we apply PRATIQUE DSSs to Phytophthora austrocedrae, a pathogen of the Cupressaceae, Thaumetopoea pityocampa, the pine processionary moth, Drosophila suzukii, spotted wing Drosophila, and Thaumatotibia leucotreta, the false codling moth. We demonstrate that complex pest risk maps are not always a high priority and suggest that simple methods may be used to determine the geographic variation in relative risks posed by invasive alien species within an area of concern.
Pest risk mapping, area of potential establishment, area at highest risk, endangered area, Phytophthora austrocedrae, Drosophila suzukii, Thaumatotibia leucotreta, Thaumetopoea pityocampa
Pest risk analysis (PRA) provides the context for this paper. PRA is fundamental to plant biosecurity because it is primarily undertaken to assess the risks posed by plant pests that are not officially established in an area and to identify appropriate phytosanitary measures to prevent entry and establishment if the risk is unacceptable. Pest risk analyses that may affect international trade should follow international standards for phytosanitary measures (especially ISPM 11;
The EPPO PRA scheme has recently been enhanced by PRATIQUE, an EU funded research project (
Summary of the PRATIQUE climatic mapping decision support scheme.
| Stage | Tasks | Detail |
|---|---|---|
| 1 | Decide whether mapping climatic suitability is appropriate | Based on available data for mapping and importance of the pest |
| 2 | Gather and interpret key climatic factors affecting distribution | Determine which data sets are important for the pest |
| 3 | Determine the quality and quantity of information that is available on the key climatic factors | Provide a rating based on availability and reliability |
| 4 | Categorise location data | Diagrams are provided to help the assessor to choose from 13 categories of location data |
| 5 | Evaluate pros and cons of different climatic mapping methods | Use tables to show possible drawbacks of the different methods available based on the ecology of the pest and the data available |
Maps provide an important method for visualising, summarising and communicating the risk posed by a pest in the PRA area that can be an officially defined country, part of a country or all or parts of several countries (
Although many PRAs already contain maps depicting components of pest risk that have been created without formal models and geographical information systems (GIS), most profit from such tools. Frequently, the PRA just includes a map of climatic suitability. Climatic suitability needs to be combined with factors such as host or habitat distribution firstly to obtain the area of potential establishment and secondly with impact related components, such as host or habitat vulnerability and value, to map the areas at highest risk. NAPPFAST provides a suite of interconnected models that can be used individually or collectively with tailored climatic data to map pest risk for North America (
The PRATIQUE DSS described by
Methods for combining maps of climatic suitability, host distribution, and host value with a simple mapping program (
Summary of the PRATIQUE endangered areas decision support scheme.
| Stage | Tasks | Detail |
|---|---|---|
| Introduction | Decide whether mapping the endangered areas is going to be possible and useful | Based on the value of additional information that this process is likely to lead to and the data available |
| 1 | Confirm the factors that influence the endangered area | Describe the area of potential establishment, gather all appropriate data including maps that can influence the endangered area. Put maps into the same resolution and enter into the mapping software MCAS |
| 2 | Combine maps to determine areas of potential establishment and areas of highest risk | Guidance is given on how to combine the different data sets to obtain the relevant maps |
| 3 | Combine maps to determine endangered areas | |
| 4 | Optional module to evaluate rate of spread | Guidance is provided on the application of spread models |
In stage 1, the key factors that influence the endangered area are identified by using the biological, ecological and agronomic information in the pest risk assessment, the geographic data sets are assembled and, where appropriate, maps of the key factors are produced listing any significant assumptions. In stage 2, methods for combining these maps to identify the area of potential establishment and the area at highest risk from pest impacts are described, documenting any assumptions and combination rules utilised. When possible and appropriate, stage 3 can then be followed to show whether economic loss will occur in the area at highest risk and to identify the endangered area. As required, stage 4, provides techniques for producing a dynamic picture of the invasion process using a suite of spread models.
In this paper, we apply the area mapping DSS to four case studies to determine the need for pest risk maps. We propose simple, quick analyses (i.e., shortcuts) to answer questions posed by the DSS and suggest these shortcuts could be particularly useful when risk maps are needed urgently, when an incursion threat seems imminent, or an outbreak has been detected. In addition, many plant health services have limited staff with skills in pest risk mapping and modelling and are faced with budget reductions. If used appropriately, the DSS can guide the production of exploratory pest risk maps created with relatively little time and resources. These exploratory analyses can still be helpful and, at minimum, can justify the need for a more detailed analysis and additional funding.
It is important to tailor efforts according to the priority for which pest risk mapping is needed to provide support for the PRA. Although strict rules cannot be set because maps provide other important functions, we have attempted to identify situations of high and low priority.
In the main, pest risk maps are more useful when the potential for invasive alien species to establish and thrive in the PRA area is highly uncertain. Thus, the highest priorities for pest risk mapping are generally for those species that also require the most attention to detail, e.g. because impacts could be high but the likelihood is uncertain. This could occur when the likelihood of establishment is considered to be uncertain but, if establishment were to occur, the magnitude of impact is expected to be high because the measures available for eradication and containment would be limited and expensive.
Risk maps can be considered to be a low priority without detailed analysis when it is already clear that:
- widespread establishment is likely, e.g. because the pest is common in neighbouring areas with similar climates and hosts or because pest outbreaks have already occurred within the PRA area demonstrating the potential for establishment and indicating that harmful impacts are likely to be uniformly distributed.
- the area of potential establishment can be identified without risk mapping, e.g. because establishment is only possible on hosts with a well defined and mapped distribution in discrete habitats or crop production systems, such as protected cultivation, and harmful impacts are likely to be uniformly distributed.
In addition to taking these priorities into account when deciding whether or not to map risk, it is also important to identify and apply any shorter or simpler methods of mapping when there is little time (for example, because an outbreak has occurred and emergency action is required in an area where the pest is not established), resources are limited, (for example, because of budgetary cuts or a lack of staff experienced in risk mapping) or the priority for risk mapping is relatively low. We therefore indicate where short cuts may be possible and discuss the implications for the PRATIQUE area mapping DSS.
To show how these priorities and the amount of detailed analysis required can match up when undertaking PRAs, four examples based on recent work by EPPO and by the Food and Environment Research Agency (FERA) and Forest Research in the UK representing a range of risk and uncertainty are explored in this paper.
This pathogen of Cupressaceae originates from Argentina and Chile and has recently been found in the UK on juniper (Juniper communis), Lawson cypress (Chamaecyparis lawsoniana) and Nootka cypress (Chamaecyparis nootkatensis) (
Since the climate is suitable for establishment throughout the UK, the area of potential establishment can be considered to be equivalent to the distribution of Juniper communis in uncultivated areas and the ornamental Cupressaceae hosts in parks and gardens. Maps of the distribution of Juniper communis and its subspecies are available from the National Biodiversity Network (see Figure 1) and the Botanic Society of the British Isles (
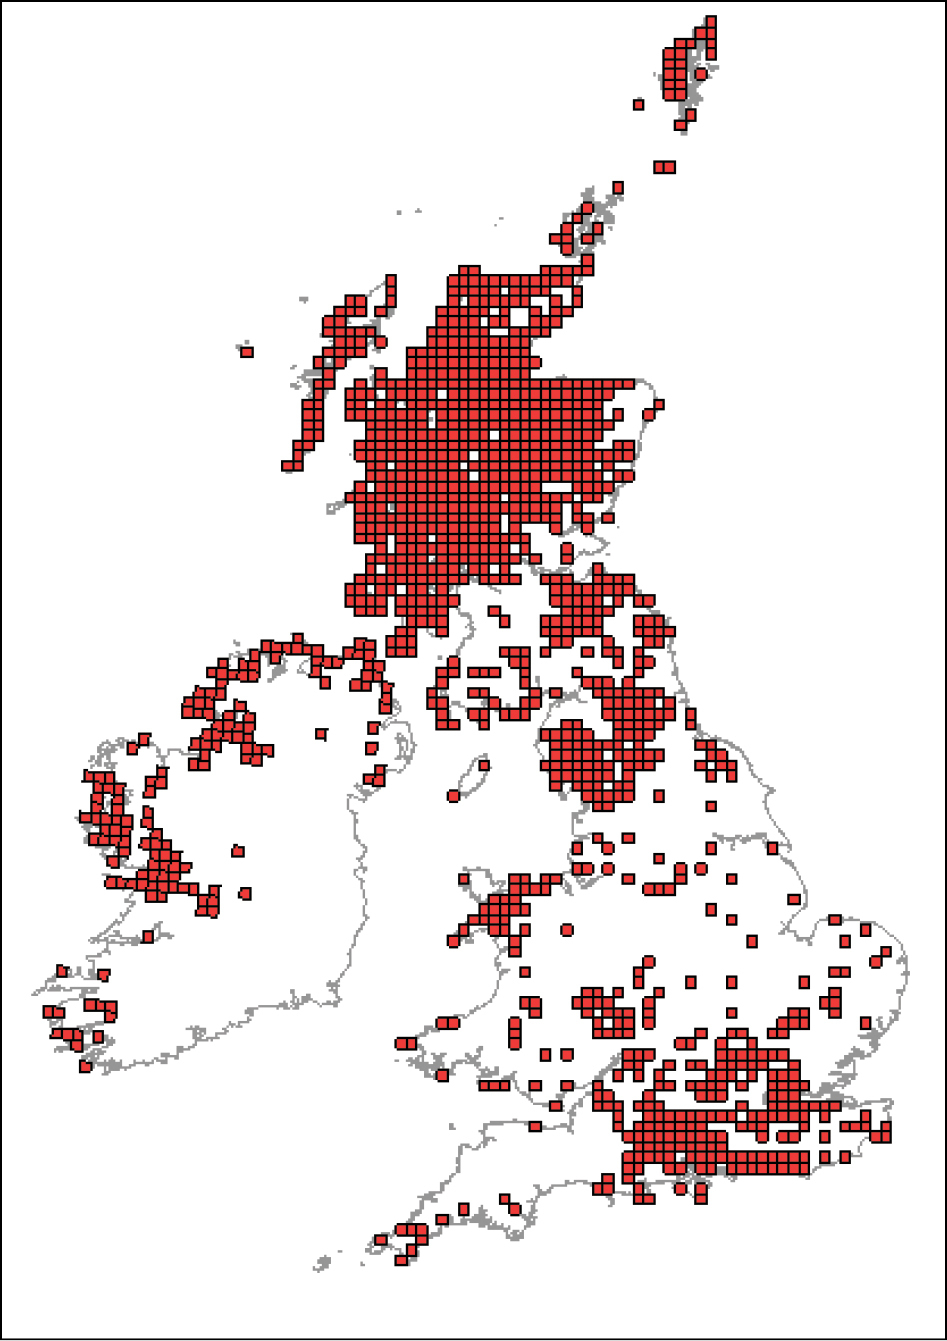
Distribution of Juniperus communis in Great Britain and Ireland from the National Biodiversity Network Gateway (NBN Gateway: data.nbn.org.uk) © Crown copyright and database rights 2011 Ordnance Survey [100017955]
This small fly lays its eggs in a wide variety of ripe and unripe soft skinned fruit and can cause significant damage (
Although considerable efforts were made to find and map all the locations where Drosophila suzukii had been recorded and to search the literature for any records of climatic responses, these conclusions were based on a relatively simple analysis. Drosophila suzukii can survive the long cold winters at its northern limits to its distribution in northern China through its association with human habitation. Since such severe winters occur very rarely in Europe and hosts are very widespread, the principal factor determining its northerly limits in Europe was considered to be the amount of degree days available for development and reproduction. A simple phenology model with a base temperature of 10°C and 250 degree days was therefore applied to the 1961-90 Climatic Research Unit monthly gridded climatology at 30 minute latitude and longitude resolution (
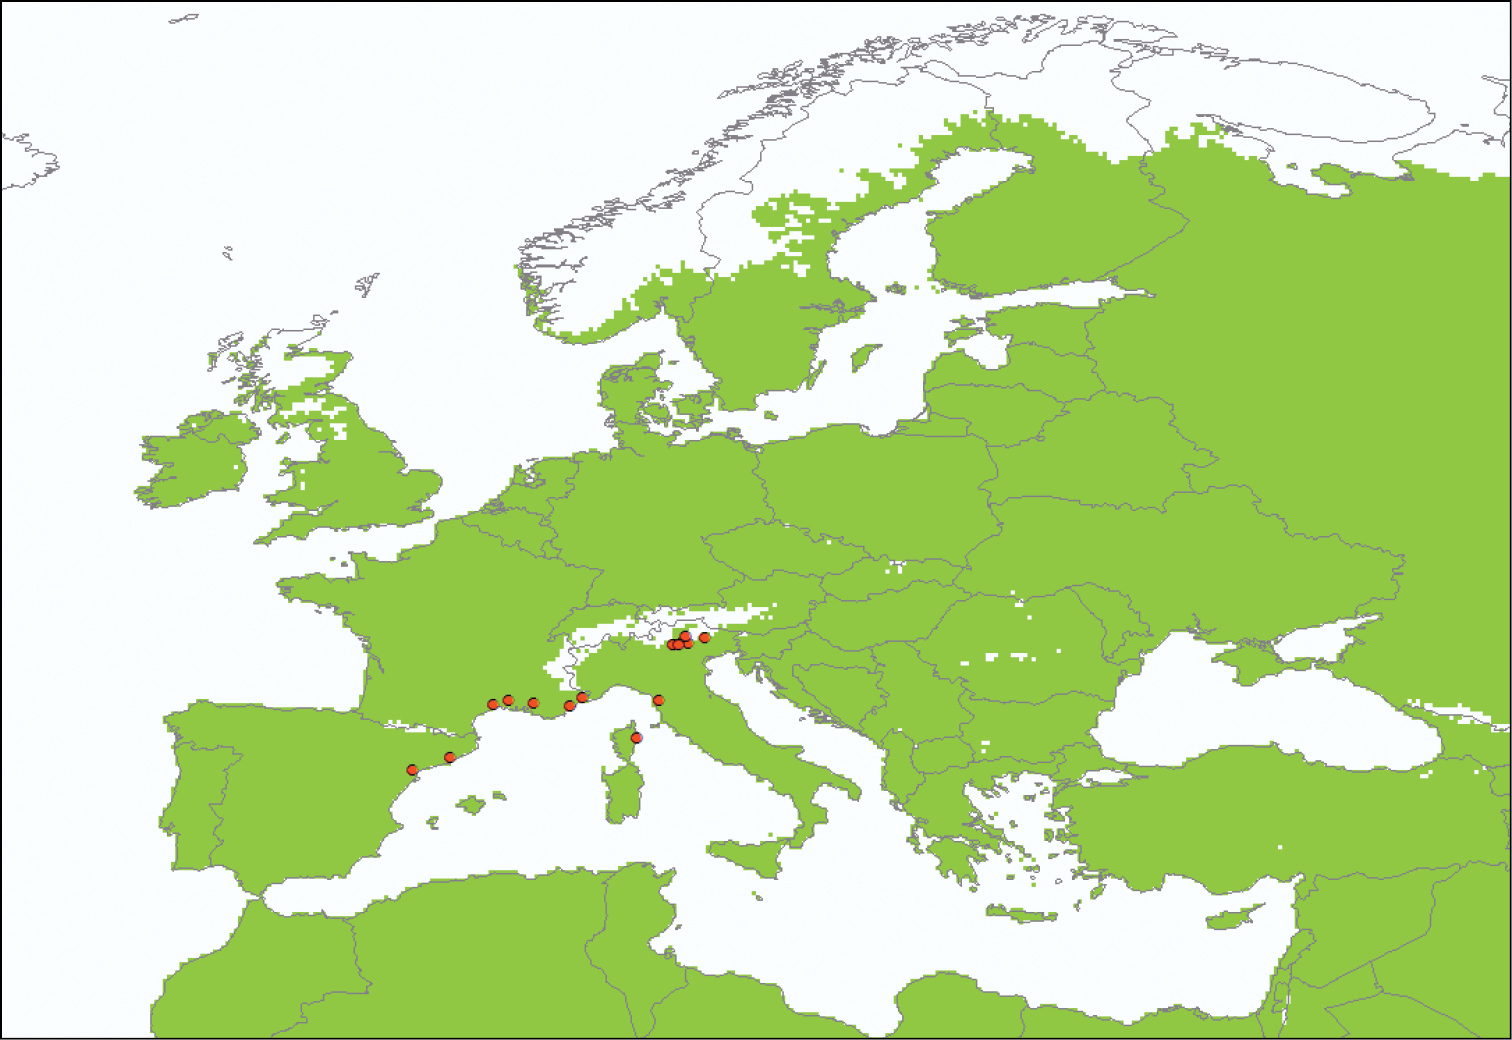
The area (in green) where annual degree day accumulations above a base temperature of 10°C exceed 250 with the locations of Drosophila suzukii known in August 2010 (in red).
This polyphagous fruit pest, the false codling moth, is native to sub-Saharan Africa and can be particularly damaging to a variety of fruits including oranges and peaches. As summarised by
A simple rule based on the difference between maximum and minimum winter temperatures above a minimum threshold fitted both the limits to the distribution in South Africa and the area in Israel where it is established. The maps generated by applying this rule to global climatologies could therefore be used to define the area of potential establishment, especially because the hosts, e.g. Ricinus communis (castor oil plant), are widespread in southern Mediterranean coastal areas. Areas of highest risk occur where the crops of major economic importance, such as oranges, are grown in the area of potential establishment. This pest can therefore be considered a relatively high priority for pest risk mapping in the EPPO Region. Outbreaks have already occurred in one area (Israel) demonstrating that establishment is possible, but more detailed mapping is required to explore the limits to its distribution in southern Europe. The mapping needs to take into account the magnitude of the potential impact together with the feasibility and expense of eradication and containment.
This pest, the pine processionary moth, defoliates Pinus species and the larval hairs can cause severe skin rashes and eye damage. Since it is widespread in the Mediterranean area and is spreading northwards in France assisted by climate change (
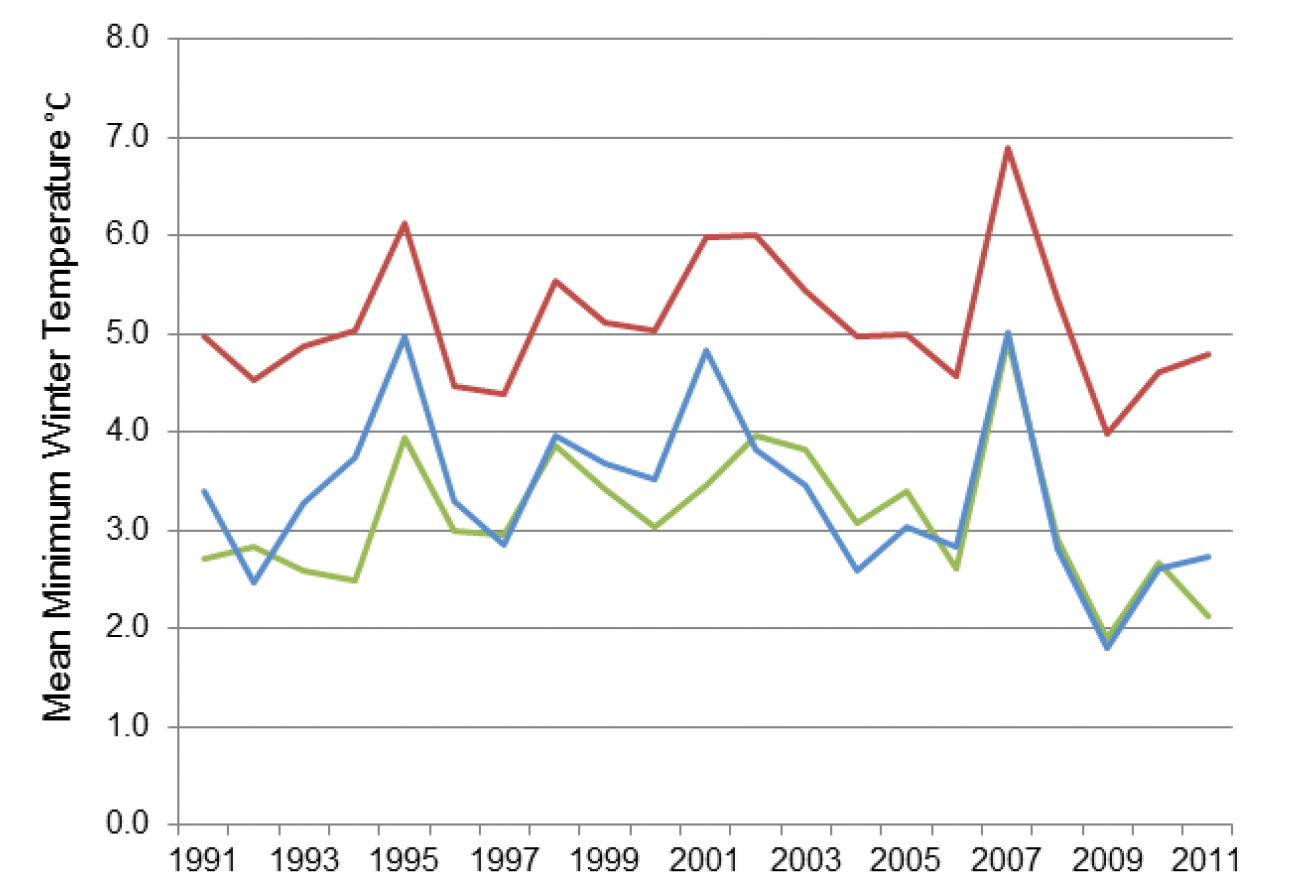
Mean minimum winter (October - March) temperatures from 1991–2011 for one location in southern UK (Hurn Airport) (coloured in green) with Orleans (blue) and Paris (red) in France. Data were obtained from the
The risk maps used to support these PRAs were all created by using short cuts and none of them utilised all components of the PRATIQUE DSSs for climatic suitability analysis (
Based on the rationale for shortcuts described above, Phytophthora austrocedrae and Phytophthora pityocampa can be considered to represent, respectively, low and high priorities for pest risk mapping. For Phytophthora austrocedrae, distribution maps of juniper for the whole country and for areas important for nature conservation were considered to be sufficient to show the area of potential establishment outside parks and gardens and the endangered area for environmental impacts, whereas even the potential for establishment of Thaumetopoea pityocampa is highly uncertain. The risk mapping priorities for Drosophila suzukii and Thaumatotibia leucotreta are intermediate. The area of potential establishment for both species was assessed with relatively simple methods based on climatic suitability analyses using, respectively, a simple phenology model and the difference between minimum and maximum winter temperatures with the distributions of the host crops primarily influencing the endangered areas and areas of highest risk.
The extent to which limited methods are appropriate to map risk is debatable because PRAs can only be validated when invasions occur. However, by ensuring that the literature has been searched comprehensively to uncover, for example, all that is known about a pest’s distribution, host range and climatic responses, greater reliance can be placed on the priority given and the methods used.
Short cuts and limited methods also generate greater uncertainty. Demonstrating uncertainty in maps remains a fundamental challenge (
Many other shortcuts are available in addition to the examples provided here. In fact the Drosophila suzukii PRA also included a visual examination of the global Köppen-Geiger climate zones (
The PRATIQUE DSSs for mapping the suitability of the climate for pest risk analysis (
This paper has focused on the additional challenges of identifying when pest risk mapping is a low and a high priority and relating this to an appropriate reduction or increase in the level of detail employed while ensuring that the uncertainties inherent in simplification are clearly demonstrated. We have shown that a number of approaches for simplifying the DSS and reducing the time taken to produce risk maps can be considered, e.g. (a) using previously published maps to help indicate risk, (b) deploying simpler models and (c) mapping key components for visual comparison without importing them all into a GIS, converting them to the same resolution and using GIS tools to highlight areas at high risk. However, the examples provided in this paper show that, to justify any shortcuts, it is always important to ensure that the literature is thoroughly searched for key information on, for example pest distribution, host/habitat range and climatic responses. In addition, any maps that have been generated from simplified approaches should be clearly documented so that the reader knows why these methods have been used and understands the uncertainties. The priorities for further research should also be indicated.
The future priorities for pest risk mapping DSSs include further testing and enhancements to address the challenges articulated in the roadmap provided by
We are very grateful to the OECD for sponsoring the workshop at which this paper was delivered. Richard Baker and Dominic Eyre thank Fera Plant Health for supporting our attendance. We acknowledge the work of many people that produced the work that is referred to in this paper. Their names are given below with their affiliation at the time of their contribution. PRATIQUE was funded by the European Union 7th Framework Programme Grant No. 212459 and the DSSs for climatic suitability and mapping the areas at highest risk were created by the authors of this paper in collaboration with Jan Benninga (LEI, The Netherlands), Johan Bremmer (LEI, The Netherlands), Maxime Dupin (INRA, France), Zhenya Ilieva (PPI, Bulgaria), Vojtech Jarosik (Institute of Botany, Czech Republic), Hella Kehlenbeck (JKI Germany), Darren Kriticos (CSIRO Australia), David Makowski (INRA, France), Jan Pergl (Institute of Botany, Czech Republic), Philippe Reynaud (ANSES, France), Christelle Robinet (INRA France), Tarek Soliman (Wageningen University, The Netherlands), Wopke Van der Werf (Wageningen University, The Netherlands) and Susan Worner (University of Lincoln, New Zealand). The rapid PRA for Phytophthora austrocedrae was written by Joan Webber, Sarah Green, and Steven Hendry from Forest Research (UK) and reviewed by Claire Sansford (Fera, UK). The EPPO Expert Working Group for the PRA on Drosophila suzukii consisted of: Richard Baker (Fera, UK), Peter Baufeld (JKI, Germany), Alberto Grassi (IASMA, Italy), Jose Maria Guitian Castrillon (TRAGSATEC, Spain), Martin Hauser (California Department of Agriculture, USA), Tracy Hueppelsheuser (British Columbia Ministry of Agriculture, Canada), Jon Knight (Imperial College, UK), Françoise Petter (EPPO), Philippe Reynaud (ANSES, France) and Rob Sunley (EPPO, France). The EPPO Expert Working Group for the PRA on Thaumatotibia leucotreta consisted of Richard Baker (Fera, UK), Peter Baufeld (JKI, Germany), Vaughan Hattingh (Citrus Research International, South Africa) Panagiotis Milonas (Benaki Phytopathological Institute, Greece), Françoise Petter (EPPO, France), Víctor Sarto i Monteys (Servei de Sanitat Vegetal, Spain) and Marja van der Straten (Plant Protection Service, The Netherlands). The rapid PRA for Thaumetopoea pityocampa was produced by: Richard Baker, Helen Anderson, Sharon Matthews-Berry and Anastasia Korycinska from Fera (UK) with comments and corrections from John Morgan (Forestry Commission, UK) and Hugh Evans (Forest Research, UK) and assistance from Christelle Robinet (INRA, France). We acknowledge the UK Meteorological Office and the E-OBS dataset from the EU-FP6 project ENSEMBLES (http://ensembles-eu.metoffice.com) and the data providers in the ECA&D project (http://eca.knmi.nl) for the meteorological data. We are grateful for the comments made by Rob Venette and the anonymous reviewers in enhancing this paper.