


(C) 2013 Hannah D. Wilbur. This is an open access article distributed under the terms of the Creative Commons Attribution License 3.0 (CC-BY), which permits unrestricted use, distribution, and reproduction in any medium, provided the original author and source are credited.
For reference, use of the paginated PDF or printed version of this article is recommended.
Citation: Wilbur HD, Alba C, Norton AP, Hufbauer RA (2013) The effect of insect herbivory on the growth and fitness of introduced Verbascum thapsus L. NeoBiota 19: 21–44. doi: 10.3897/neobiota.19.5123
A majority of the plant species that are introduced into new ranges either do not become established, or become naturalized yet do not attain high densities and are thus considered ecologically and economically unproblematic. The factors that limit these relatively “benign” species are not well studied. The biotic resistance hypothesis predicts that herbivores, pathogens and competition reduce growth and reproduction of individual plants and so suppress population growth of non-native species. We explored the effect of insect herbivory and surrounding vegetation on growth and fitness of the non-native biennial plant Verbascum thapsus (common mullein) in Colorado, USA. Mullein is widespread in its introduced North American range, yet is infrequently considered a management concern because populations are often ephemeral and restricted to disturbed sites. To evaluate the impact of insect herbivores on mullein performance, we reduced herbivory using an insecticide treatment and compared sprayed plants to those exposed to ambient levels of herbivory. Reducing herbivory increased survival from rosette to reproduction by 7%, from 70–77%. Of plants that survived, reducing herbivory increased plant area in the first year and plant height, the length of the reproductive spike, and seed set during the second year. Reducing herbivory also had a marked effect on plant fitness, increasing seed set by 50%, from about 48, 000 seeds per plant under ambient herbivory to about 98, 000 per plant under reduced herbivory. Our findings also highlight that the relationship between herbivory and performance is complex. Among plants exposed to ambient herbivory, we observed a positive relationship between damage and performance, suggesting that, as predicted by the plant vigor hypothesis, insect herbivores choose the largest plants for feeding when their choice is not restricted by insecticide treatment. In contrast to the strong effects of experimentally reduced herbivory, we found that cover of other plants surrounding our focal plants explained relatively little variation in performance outcomes. Overall, we found that herbivore-induced impacts on individual plant performance and seed set are substantial, and thus may help prevent this naturalized species from becoming dominant in undisturbed recipient communities.
Biotic resistance, competition, common mullein, performance, seed set, insecticide
There are over 29 published hypotheses addressing the success of introduced species in their new range (
To better understand the mechanisms that enable some introduced species to dominate their new communities we must determine which mechanisms prevent other introduced species from doing so (
Recent work illustrates the dual roles of herbivory in shaping the outcome of invasions. In a meta-analysis,
Our broad goal here is to gain insight into the processes affecting introduced species that do not regularly dominate their recipient communities. Specifically, we explored the effects of insect herbivory on the performance and fitness of Verbascum thapsus (common mullein), by reducing insect herbivory using insecticides. Common mullein is an herbaceous biennial that has been present for several centuries in the North America following its introduction from Europe. It is ideal for exploring biotic resistance mediated by insect herbivores: previous research documents shifts in its ecology in the introduced North American range (
Mullein is a monocarpic forb with an annual to triennial life cycle (
Mullein reproduces purely by seed. Seeds are small (50 to 100 µm in diameter) and plants are quite prolific; a single plant may produce more than 100, 000 seeds in its lifetime (
Mullein populations in the mountain west of the U.S. are more dense and larger, and individual plants are also larger, than are those in the native European range (
Despite evidence for enemy release at the biogeographic scale, substantial herbivory by generalists as well as co-introduced specialists can occur in introduced populations (
To evaluate the effects of herbivory on performance of common mullein, we experimentally reduced herbivory on plants in the field using insecticides. We imposed two main treatments: reduced herbivory (insecticide) and ambient herbivory (water). Additionally, we added a set of no-water control plants part way through the experiment. We evaluated whether reduced herbivore damage increased survival to reproduction, performance during the first growing season (rosette area, leaf number, and biomass), performance in the second growing season (plant height, inflorescence length) and performance when protected from herbivory during both growing seasons (plant height, inflorescence length and seed production).
The experiment took place at a site in Loveland, CO (40°22'29"N, 105°13'32"W, elevation 1650 m) with a history of substantial disturbance, including being used as a staging area for a large construction project and for grazing. The site is currently owned by Larimer County and is maintained as open space. This site was chosen along with two additional sites (which were lost during severe hail storms in the early stages of the study) for three main reasons: the sites had vegetation representative of other areas in the foothills where common mullein is present, land managers were willing to stop controlling common mullein and other weeds for the duration of the study (i.e. no herbicides, mowing or cutting would take place), and finally, we were able to get permission to spray insecticides as the sites received relatively little foot traffic. Plants along 12 transects were marked with a raised nail and metal tag, and assigned randomly to one of the two main treatments: reduced herbivory (insecticide) or ambient herbivory (water). We started with 551 plants in April 2009. This comprised both overwintered rosettes, which we followed until they bolted (n = 126) and first-year rosettes (n = 425), a subset of which we harvested after the first summer (n = 70), and the rest of which were followed through their entire lifecycle (n = 355). In spring 2010, we started tracking an additional 42 plants along the same transects, which received neither insecticide nor water. Table 1 summarizes sample sizes for the first-year rosettes that were then followed for two seasons.
Sample sizes, mortality, and proportion mortality for the plants (first year rosettes) followed for two growing seasons. Formulas reference the first column of letters to indicate how calculations were done.
| Sample size or proportion | Reduced Herbivory | Ambient | Totals | |
|---|---|---|---|---|
| a | Start of experiment Spring 2009 | 207 | 218 | 425 |
| b | Fall 2009 Harvest |
36 | 34 | 70 |
| c | Fall 2009 Performance data collection |
175 | 169 | 344 |
| d | Summer 2009 Mortality | 27 | 39 | 66 |
| e | Proportion dead Summer 2009 (d/[a-b]) | 0.16 | 0.21 | |
| f | Overwintering Mortality | 2 | 5 | 7 |
| g | Overwinter missing (presumed dead) | 8 | 7 | 15 |
| h | Proportion dead overwinter ([f+g]/[a-b-d]) | 0.07 | 0.08 | |
| i | Number Spring 2010 |
133 | 133 | 266 |
| j | Summer 2010 Mortality | 3 | 4 | 7 |
| k | Proportion dead Summer 2010 (j/i) | 0.02 | 0.03 | |
| l | Bolted 2010 | 128 | 122 | 250 |
| m | Did not bolt | 2 | 7 | 9 |
| n | Total mortality (d+f+g+j) | 40 | 55 | 95 |
| o | Total proportion dead (n/[a-b])) | 0.23 | 0.30 | |
| p | Proportion that did not reproduce ([m+n]/[a-b]) | 0.25 | 0.34 |
1 Harvest of 70 of the first-year rosettes, fall 2009, to measure biomass.
2 Number of plants for which data on number of leaves and rosette area were recorded in year 1. These included plants on which biomass was measured. Some plants were missed, and thus, this column plus summer mortality does not sum to exactly the same number as at the start.
3 This is the number of plants starting in the second season. It is approximately equal to the number at the Start of Experiment minus (Fall 2009 Harvest + Summer 2009 Mortality + Overwintering Mortality). (Not exactly due to unintended things like incorrectly applied treatments)
Plants were sprayed with either an insecticide solution or water every two weeks during the growing season using a 5-gallon (18.9-liter) Solo backpack sprayer. We investigated whether the water added in the ambient herbivory treatment increased plant performance by comparing those plants to the additional 42 plants that received no treatment.
The first insecticide application was a mixture of esfenvalerate, (33112 Insecticide Concentrate, Bengal Products, Inc. 3.48% active ingredient esfenvalerate) which has been shown to have no or little effect on plant growth (
We used Bayer Advanced Dual Action Rose & Flower Insect Killer Concentrate with active ingredients imidocloprid (0.72%) and beta-cyfluthrin (0.72%) for all subsequent herbivory reduction treatments. We switched because we anticipated getting more effective control with this systemic insecticide. We first tested whether it affected mullein growth, and observed no effects (Appendix), a finding supported by
To evaluate the effectiveness of the insecticide in reducing herbivory and to gather data for inclusion in subsequent analyses, we estimated leaf herbivory experienced by each plant every month during both growing seasons. Herbivory was scored from low to high (0 to 4) following
The specialist seed predator Gymnetron tetrum consumes nearly all seeds in locules it infests within a given fruit capsule (
Cover of plants surrounding target individuals may negatively affect growth via competition, or alternatively may be associated with higher quality sites and greater plant growth. To take these types of processes into account, we estimated the percent cover of plant functional groups and bare ground directly adjacent to each mullein plant. We used a digital camera (Nikon D90, AF-S Nikkor 18-105 mm 3.5-5.6G ED lens, automatic setting), placed 68 cm above the ground, to photograph cover quadrats during the first week of June in both 2009 and 2010. For small first-year plants, we centered a 30 × 30 cm frame around each plant and estimated cover within the frame, excluding the mullein plant itself. For larger second-year plants, we placed a 15 × 30 cm frame adjacent to the plant, in each of the four cardinal directions. The cover photos were processed using SamplePoint according to the methods described in
At the beginning of the growing season, before treatment, we estimated the area of first- and second-year rosettes (from measurements of diameter in both directions) and estimated levels of herbivore damage on the leaves. For first-year rosettes, at the end of the growing season, we collected information on survival and growth of each plant. For these plants (n = 344 after summer mortality) we measured rosette area, counted the number of leaves, and took a final estimate of herbivore damage for the year. A subset of these plants (n = 70) was harvested to obtain biomass data. We removed plants at their base and oven dried them to constant weight before weighing them to the nearest 0.1 g.
Most second-year plants that started as overwintered rosettes in the spring of 2009 bolted that year, and were harvested as they senesced in mid-September 2009. For each plant we measured plant height, inflorescence length (from the first seed capsule at the base of the reproductive stalk to the top of the stalk), and number of branches.
In April of 2010 we identified all first-year plants that had overwintered successfully (n = 266) and resumed treatment regimes. At the end of the growing season we measured plant height, main stem inflorescence length, and total inflorescence length (i.e., including axillary branches). Additionally, on a subset of plants, we measured seed capsule density and the number of seeds per seed capsule as described below. From these measurements, we calculated the total number of seed capsules per plant, and extrapolated to the total seed set per plant.
Seed capsule density. We measured the density of seed capsules on all of the 259 plants that survived to produce inflorescences greater than 5cm in length (nambient = 107, nreduced = 110). We used this cut-off, because seed capsules in the top 5 cm of the inflorescence were smaller and denser than the rest of the inflorescence, and often did not contain successfully developed seeds, and thus were not representative of the inflorescence as a whole. On the plants for which we measured seed capsule density, we counted all seed capsules in a 20 cm length of inflorescence, starting 5 cm from the top. When the inflorescence was shorter than 25 cm, the top 5 cm was still not counted, but all the remaining seed capsules were.
Number of seed capsules. We calculated the number of seed capsules per plant by multiplying the seed capsule density by the total length of the inflorescence.
Number of seeds per seed capsule. To determine the average number of seeds produced per capsule, we collected individual seed capsules from a subset of plants (nambient = 24, nreduced = 22). We removed seed capsules at equal intervals along the inflorescence for a total of 7 seed capsules per plant. Seed capsules were only collected if the capsule was not yet opened and thus had its full complement of seeds. Each seed capsule was placed in its own envelope. We counted out and weighed 50 seeds from each capsule, then weighed all of the seeds in the capsule. The number of seeds per capsule was then estimated by dividing total mass by mass per seed. Sample size was reduced from 7 from each of the plants to one or two, due to weevil infestation.
To assess the effectiveness of the insecticide treatment in reducing chewing herbivory, we used the MIXED procedure in SAS 9.2 (SAS, 2012). We evaluated whether herbivory in the first month of the season was comparable across treatments to confirm that there was not an unintentional bias in herbivory at the outset of the experiment. Then we evaluated treatment effectiveness in reducing herbivory by evaluating annual average herbivory. We used the average across months because it had the best explanatory power for the plant performance analyses described below (according to comparisons of AIC, analyses not shown). Treatment was included in these models as a fixed effect and transect as a random effect. We used the GLIMMIX procedure (SAS 9.2) to evaluate whether treatment altered the proportion of seed capsules with weevils, using the events/trials syntax, and a logit link.
To evaluate the effects of water addition from insecticide treatments on plant growth, we used a mixed model to compare plants that had received the water-only treatment (ambient herbivory) to the untreated plants. We included treatment as a fixed effect and transect as a random effect. We performed separate ANOVAs for each of the response variables, which included plant height, total inflorescence length, and seed capsules per plant.
We used PROC GLIMMIX in SAS 9.2 with a binomial error distribution (alive vs. dead) to test for differences in survival among treatments for the plants treated for both growing seasons. The model included treatment as a fixed effect and transect as a random effect. Covariates (additional fixed effects) included initial plant size, vegetative cover, and average herbivore damage. While the insecticide treatment was effective at reducing insect attack (see results below), it did not prevent it all together, and levels of herbivore damage were variable within each treatment. Thus, it was also important to include the measure of herbivory.
To evaluate the effects of herbivory on the performance of mullein that survived, we created mixed models in JMP. For first-year plants (measurements taken at the end of the first growing season), response variables were final rosette area, number of leaves per rosette, and rosette biomass. The model included treatment (ambient vs. reduced herbivory), initial rosette area in 2009, cover of surrounding vegetation, average herbivore damage through the season, and the interaction between herbivore damage and treatment as fixed effects and transect as a random effect. For second-year reproductive plants (measurements taken at the end of the experiment), the response variables analyzed using this model included plant height, inflorescence length, number of seed capsules per plant and number of seeds per capsule. The model was the same as for the first-year plants, except that cover data for both years and average herbivory over both years were included. As plants were located along transects, we also checked for serial correlation in the data (spatial correlation along one dimension). There was no evidence for such autocorrelation, thus number along transect was not included in any models (analyses not shown). For several analyses, the Satterthwaite approximation was used in calculating degrees of freedom, as it does not assume variances are equal across sample groups. This can result in non-integer degrees of freedom.
For the above models, we log transformed initial and final area of rosettes, total inflorescence length, and number of seed capsules, to improve the normality of the residuals. All data presented have been back-transformed for ease of interpretation.
Damage did not differ between the plants assigned to the two treatments prior to the start of the experiment (meanambient = 1.0, meanreduced = 1.0, F1, 528.3 = 0.03, P = 0.87), indicating no bias in treatment assignments at the outset. Subsequent insecticide application significantly reduced average herbivory in 2009 (meanambient = 1.4, meanreduced = 1.1, F1, 527 = 27.59, P < 0.0001). Patterns of damage were similar in the second year. In the spring of 2010, the first damage estimates did not differ between treatment groups (meanambient = 0.6, meanreduced = 0.7, F1, 255.7 = 0.50, P = 0.48), but rates of herbivory were low at that time. By the second month, levels of leaf herbivory had increased overall, but were significantly lower in the insecticide treated plants relative to the water controls, and this continued to be the case until the experiment was terminated in the fall of 2010 (meanambient = 1.8, meanreduced = 1.0, F1, 259.8 = 1.06.1, P < 0.0001). Insecticide treatment reduced attack by the seed-feeding weevil Gymnetron tetrum (F1, 96, P < 0.0001) from 24% in water controls to 20% in the insecticide treated plants.
Plants in the ambient herbivory (water-only) treatment did not differ from untreated (i.e. no water) controls with respect to plant height (F1, 155 = 0.3454, P = 0.56), total inflorescence length (F1, 157 = 0.4545, P = 0.50), or seed capsules per plant (F1, 147 = 0.0053, P = 0.94).
Reducing herbivory over both growing seasons significantly increased survival by 7% (from 70% to 77%, F1, 323 = 8.1, P = 0.005). Interestingly, neither initial plant size nor percent cover of surrounding vegetation altered survival rates.
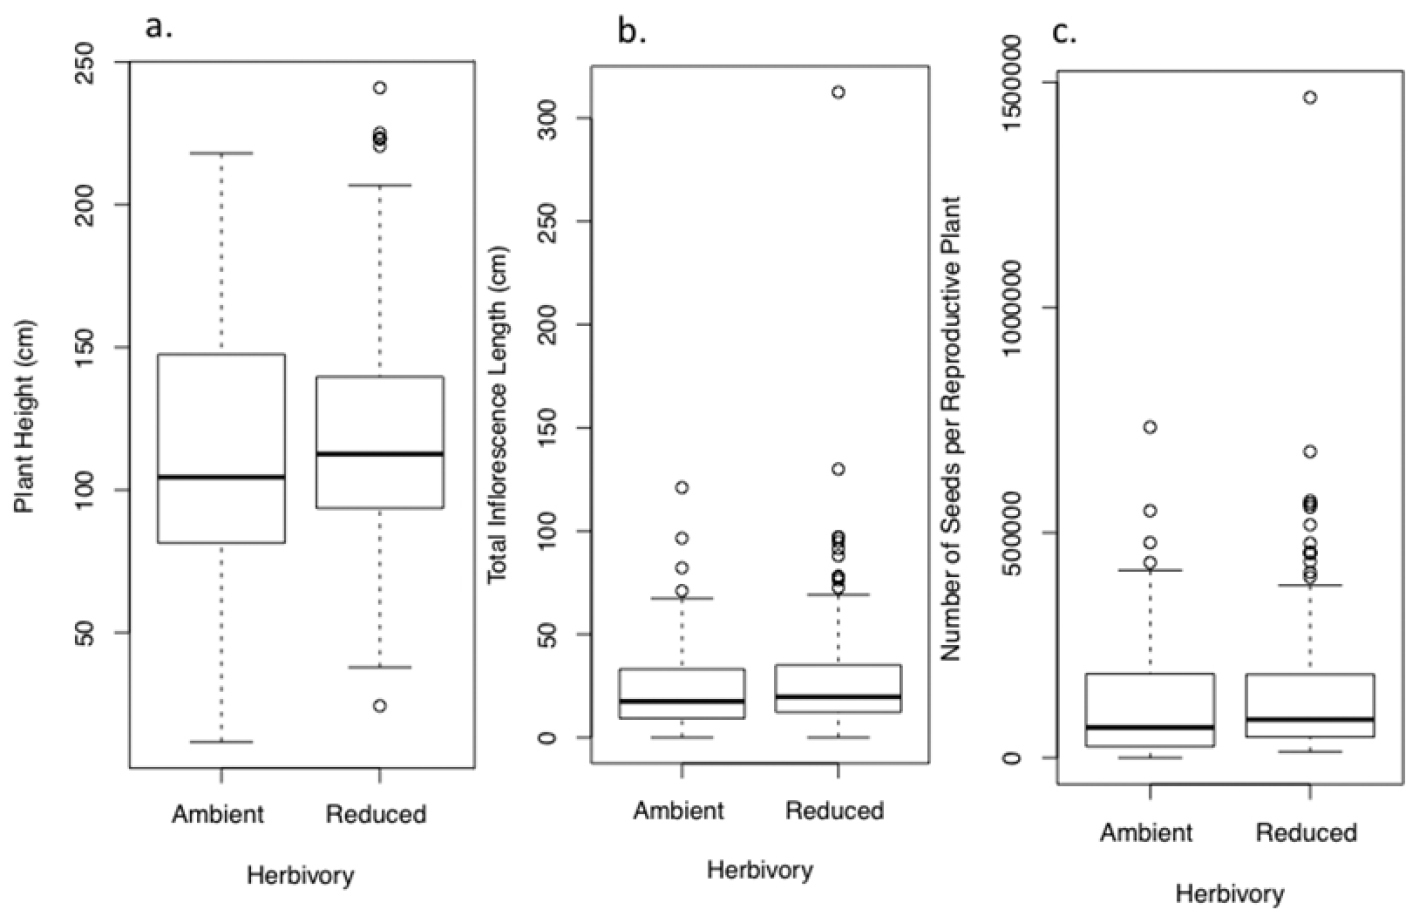
At the end of the first growing season, plants in the reduced herbivory treatment had rosettes with area 17% larger than plants in the ambient herbivory treatment (F1, 332.7 = 5.1, P = 0.025, Fig. 1a, Fig. S1a). Despite their greater area, they had comparable numbers of leaves (F1, 333.7 = 0.31, P = 0.57, Fig. 1b, Fig. S1b) and biomass (F1, 62 = 0.25, P = 0.62, Fig. 1c, Fig. S1c). In both the reduced and ambient herbivory treatment, herbivores chose larger plants, generating a positive relationship between herbivory and rosette area across treatments (F1, 333.7 = 4.6, P = 0.03). Final rosette area (F1, 336.9 = 14.3, P = 0.0002), number of leaves (F1, 336.9 = 30.2, P < 0.0001), and biomass (F1, 61.2 = 4.43, P = 0.04) were all positively related to initial area, but were not influenced by cover of other plants (final area F1, 336 = 2.60, P = 0.11; number of leaves per plant F1, 330.7= 1.7, P = 0.19; biomass F1, 63 = 0.03, P = 0.86).
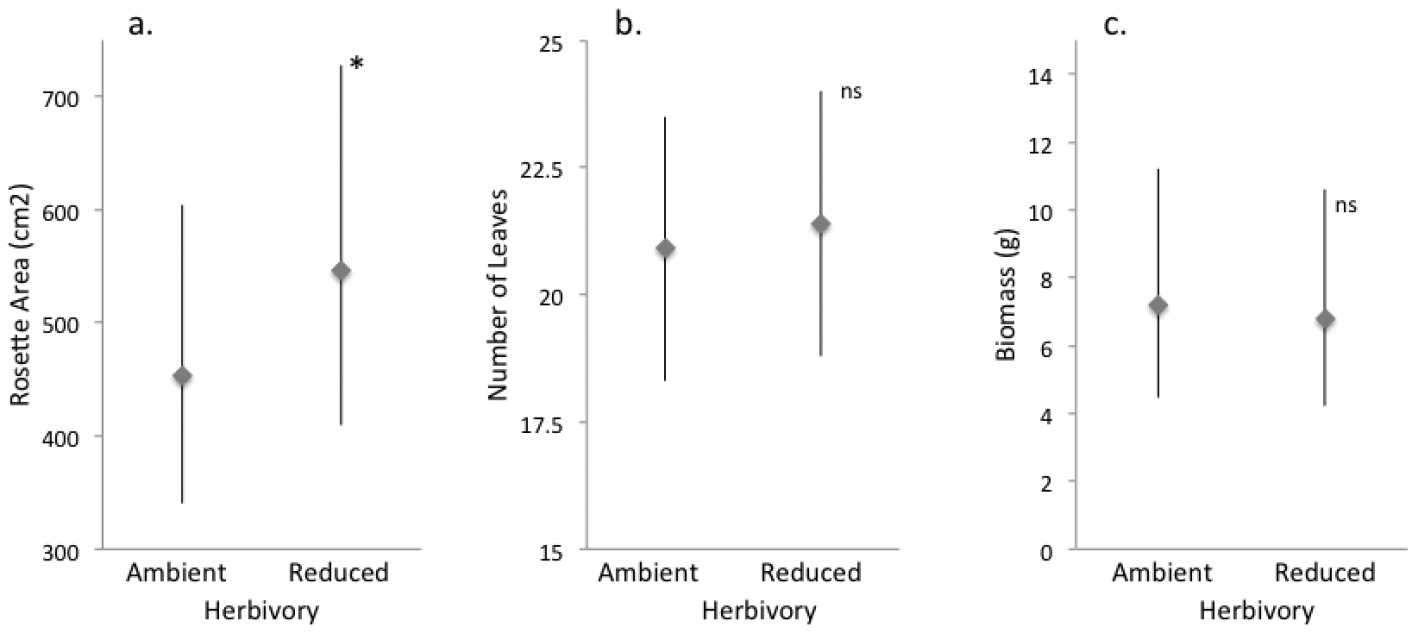
Effect of ambient and reduced herbivory on size of rosettes of Verbascum thapsus at the end of one field season of treatment (the plants’ first growing season). Panels show A final rosette area B number of leaves and C biomass. Values are model means (backtransformed as appropriate) ± 1.96SE. A single asterisk indicates a significant treatment difference at P< 0.05; ns = not significant. See Tables S1a–c for details, and Figure S1a for a box-and-whisker plot provided for data visualization.
Experimentally reducing herbivory increased performance relative to the ambient herbivory controls in the bolting plants. This was true for plants treated for only their second growing season (2009 bolting plants, see supplementary Tables S2a, b) and for those treated for both growing seasons (2010, Tables S3a–d). Specifically, reducing herbivory in only the second growing season (plants that bolted in 2009) increased plant height 8.8% (14 cm, Fig. 2a) and total inflorescence length 12.8% (6.5 cm, Fig. 2b), though the latter difference was only marginally significant. For the plants treated in only their second season, initial rosette area (measured as an overwintered rosette in spring 2009) was associated with taller plants and longer inflorescences (Tables S2a, b) and percentage cover of other plants was associated with shorter plants but this did not change inflorescence length (Tables S2a, b). Greater plant height and inflorescence length was associated with higher average herbivory levels (Tables S2a, b), a pattern discussed further below. For plant height, there was a significant interaction between average herbivory and treatment, such that insect herbivores fed more on larger plants experiencing the ambient herbivory treatment than on smaller ones, but no such pattern was found for plants under reduced herbivory.
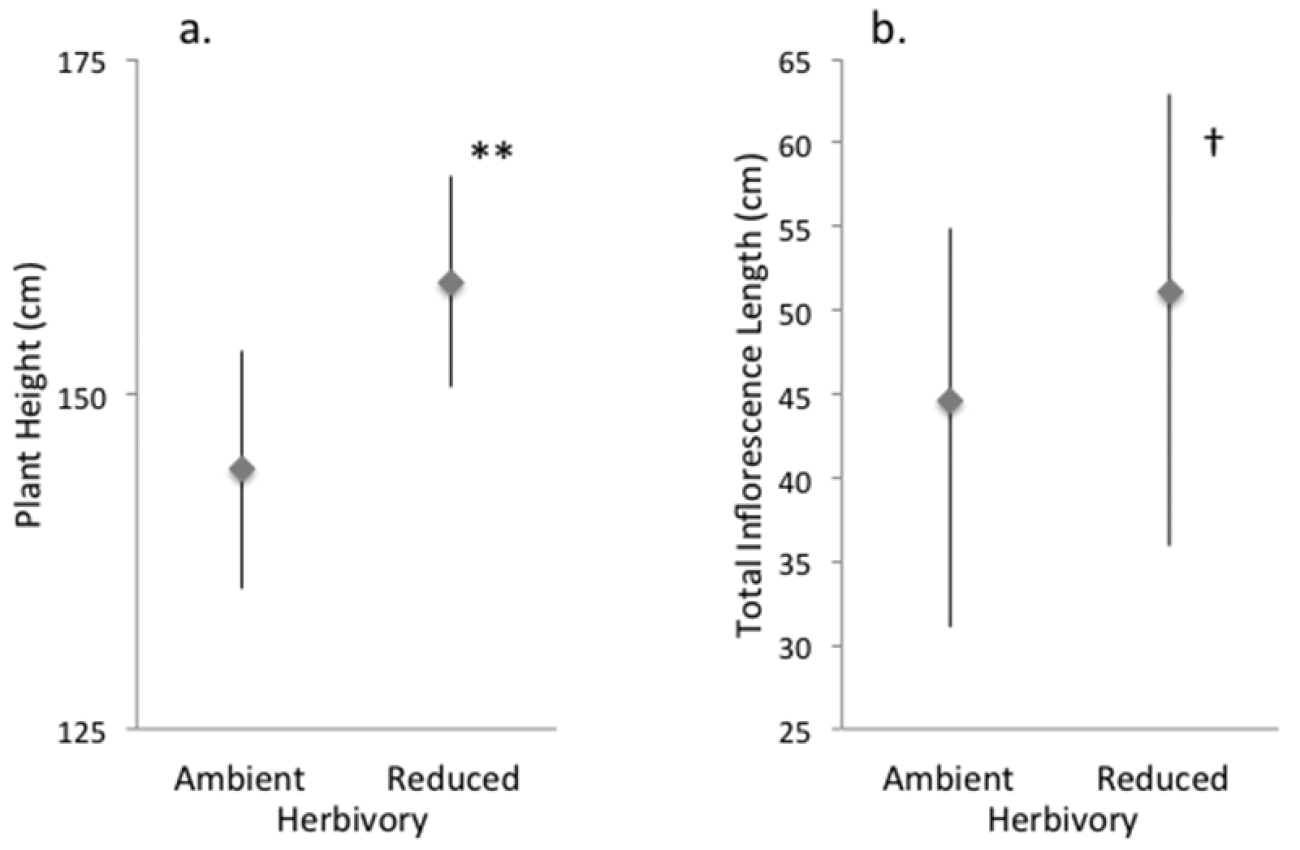
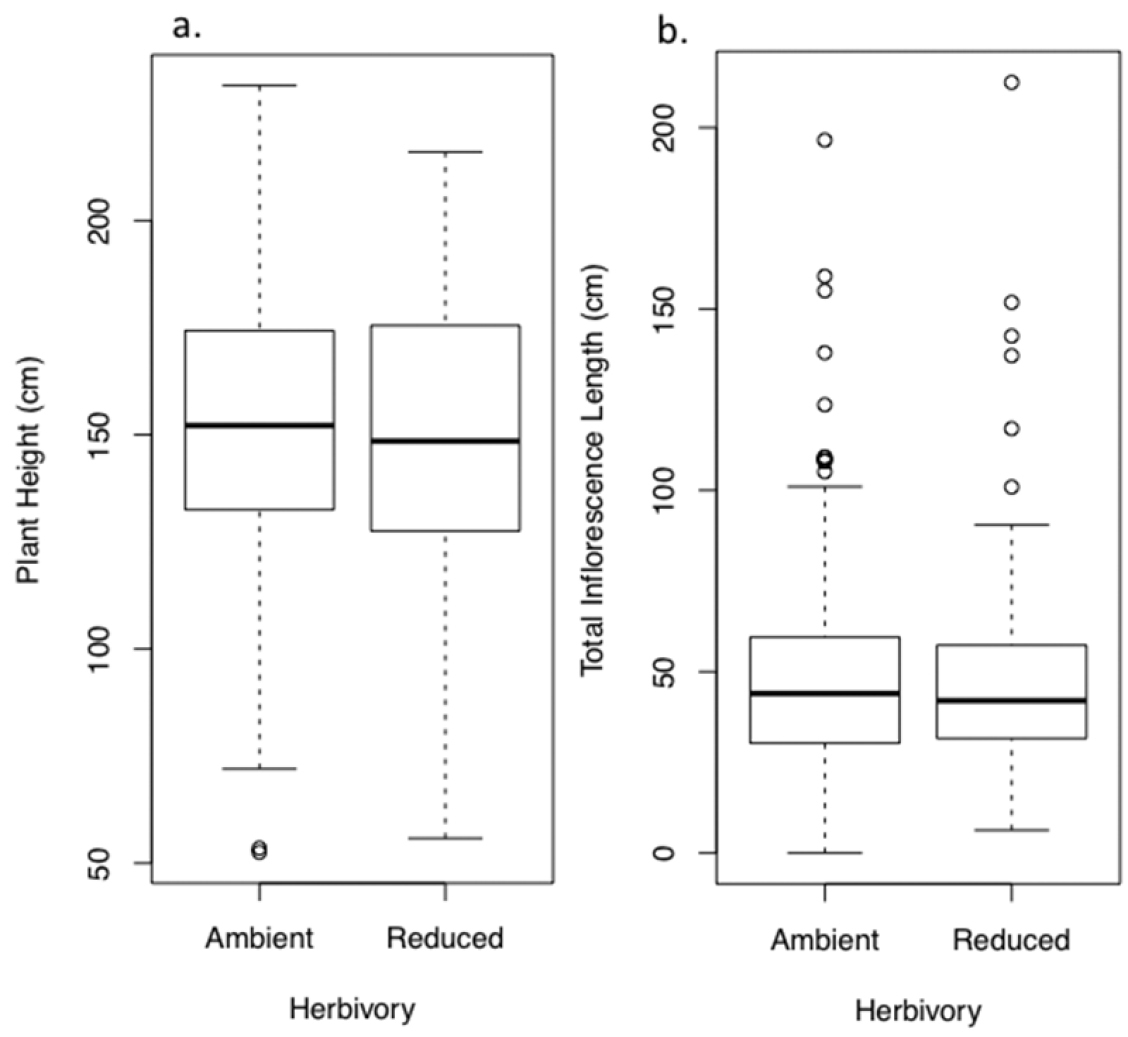
Effect of ambient and reduced herbivory on characteristics of bolting plants after one field season of treatment (the plants’ second growing season). Panels show A plant height and B inflorescence length. Values are model means (backtransformed as appropriate) ± 1.96SE. Two asterisks indicate a significant treatment difference at P < 0.005; † indicates P < 0.10. See Tables S2a, b for details, and Figure S1b for a box-and-whisker plot provided for data visualization.
Reducing herbivory over two growing seasons increased plant height by 15.6% (19.1 cm, F1, 235.3 = 10.99, P = 0.001, Fig. 3a), and increased total inflorescence length by 37.8% (8.1 cm, F1, 236.5 = 15.7, P < 0.0001, Fig. 3b). Reducing herbivory also increased the density of seed capsules (number per cm of inflorescence from 7.3 to 8.7, F1, 207 = 9.1, P = 0.003). Thus, combining the effects on inflorescence length and capsule density, the total number of seeds per plant was increased a substantial 49% from about 48, 000 seeds per plant under ambient herbivory to about 98, 000 per plant under reduced herbivory (F1, 203.2 = 22.6, P < 0.0001, Fig. 3c). The number of seeds per seed capsule remained comparable between treatments (grand mean of 451, F1, 37.8 = 1.6, P = 0.21).
For most performance traits, cover of other plants had modest effects while initial rosette area (in spring of 2009) had substantial effects (Tables S2 and S3). Additionally, there was a significant interaction between average herbivore damage and treatment for most responses due to a positive relationship between herbivory and plant performance for ambient herbivory (water control) plants and no relationship between herbivory and plant performance for reduced herbivory plants (Tables S2 and S3).
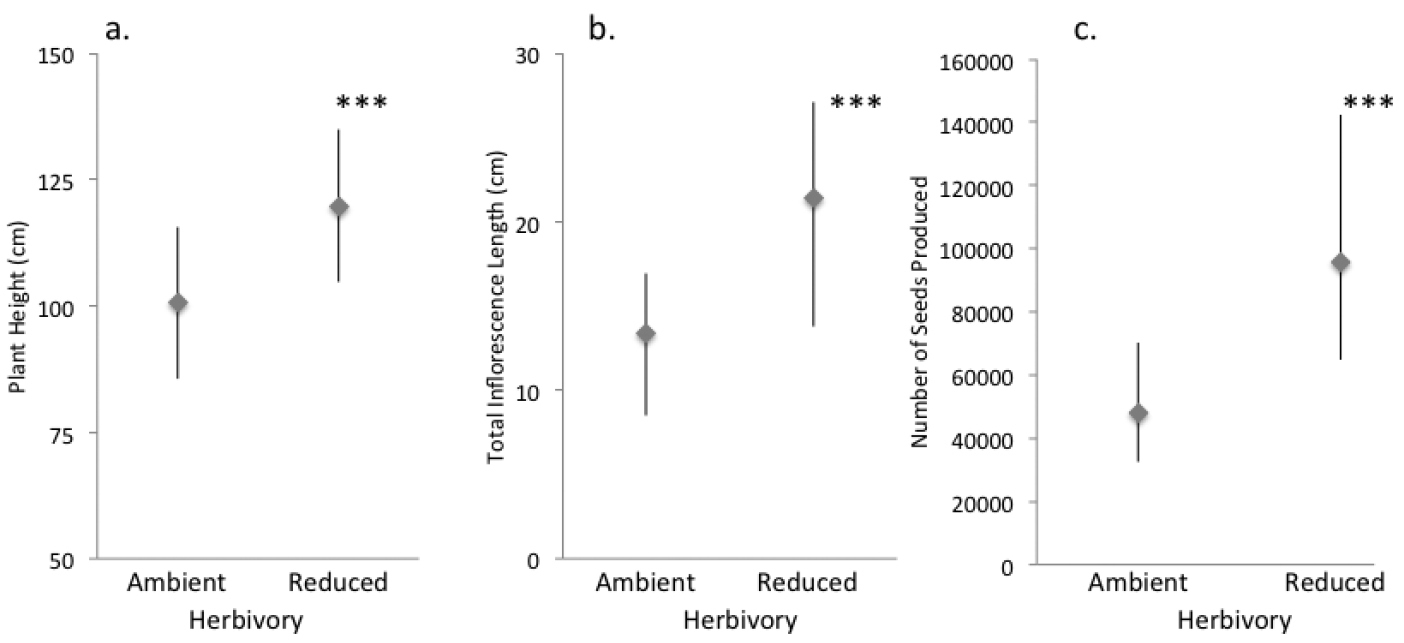
Effect of ambient and reduced herbivory on performance after two field seasons of treatment. Panels show A plant height B inflorescence length, and C seed production of those plants that reproduced. Values are model means (backtransformed as appropriate) ± 1.96SE. Three asterisks indicate a significant treatment difference at P < 0.0001. See Tables S3a–d for details, and Figure S1c for a box-and-whisker plot provided for data visualization.
To elucidate the role that native herbivores and plant competitors serve in resisting invasion, it is necessary to expand current work in invasion biology to include species that are not particularly dominant in their new range. Our work adds to the sparse experimental information available for non-native plants in the middle of the spectrum between benign and strongly detrimental. It also lends insight into the importance of herbivory in shaping various aspects of performance, including lifetime fitness, of plants belonging to this under-studied group.
Our data reveal that herbivory can reduce the performance of mullein at several stages during its life cycle. This evidence for biotic resistance by herbivores present in the recipient community contrasts with the fact that, at a biogeographic scale, mullein in the introduced range incurs significantly less chewing damage than mullein in its native range, and is attacked by fewer types of specialists (
Because mullein is semelparous and cannot spread vegetatively, the most effective form of biotic resistance would prohibit survival to reproduction. This was observed for common mullein, with plants experiencing less herbivory having a 7% higher chance of survival overall. Further, this difference in survival was detected even though reduced herbivory plants were attacked, albeit at a lower level.
Increased performance associated with reduced herbivory was apparent even in a single growing season. First-year rosettes experiencing reduced herbivory had larger area than those exposed to herbivory. Larger overwintering rosettes in turn produced taller plants in the next season and eventually produced more seed per plant. This finding illustrates that even a partial release from herbivore pressure during the rosette stage can have a significant impact on plant fitness. The importance of rosette size in determining the reproductive output of mullein has also been illustrated in introduced populations growing in the eastern U.S.
Reducing herbivory on bolting plants during only the second growing season (2009) significantly increased plant height (Figure 3). This increase in plant height has the potential to mediate ecological interactions with pollinators in the introduced range, which can in turn alter seed set. The flowers of tall mullein plants are more apt to be pollinated than flowers of short plants (
Reducing herbivory for two growing seasons revealed that insect herbivory inhibits growth of mullein by reducing plant height, inflorescence length, and seed capsule density, which together lowers the number of seeds produced per plant, i.e., fitness. In our analyses, we separated survival from seed production of surviving plants. However, if we consider those that did not survive produce zero seeds by definition, then the reductions in seed set would be even larger.
This large reduction, however, begs the question of whether or not common mullein populations are seed limited or site limited (
We have shown that reducing herbivory on introduced mullein directly affects several plant performance metrics. Additionally, we have uncovered an interesting pattern that provides support for the plant vigor hypothesis, which states that herbivores prefer to feed on more vigorous or apparent plants (
While introduced mullein has spread throughout North America, our data suggest that top-down regulation may help prevent the species from becoming more ecologically harmful. Our data also illustrate that even when introduced species escape from enemies and exhibit increased performance at a biogeographic scale, herbivores present in the introduced community can still impose biotic resistance at several points during the life cycle. Subsequent work with mullein and other relatively “benign” introduced species should explore how different forms of biotic resistance (e.g., via herbivory and competition) interact to shape population growth rates. More generally, for research on biological invasions to advance, it is imperative that we study not just the factors that facilitate invasion of successful invaders, but also those that inhibit population growth of less successful invaders.
This research was made possible with support from the Colorado Agricultural Experiment Station. We thank Larimer County for granting access to the research plot. Janet Hardin provided invaluable assistance with the experiment. RAH acknowledges the support of Fulbright France, and INRA CGBP. C. A. was partially funded by long-term research development project no. RVO 67985939 (from the Academy of Sciences of the Czech Republic) during the writing of this manuscript. This work benefitted from discussions at meetings of the Global Invasions Network, supported by supported by the US National Science Foundation research coordination program under grant no. 0541673.
We evaluated the effect of Bayer Advanced Dual Action Rose & Flower Insect Killer (ready-to-use) on Verbascum thapsus plant growth.
Seeds were collected from the field site in Loveland, Colorado in 2008. After one month at room temperature, they were moved to 4 degrees C for two weeks and subsequently kept in the refrigerator until ready for use.
The seedlings were germinated in plugs of germination soil mix that had been treated with fungicide on July 1, 2009. After one month, on July 31, plugs were transferred to 4.5 × 4.5 cm pots of fritted clay (Turface). Eight plants from each of 10 parent plants were grown for a total of 80 plants. The day that plants were transferred, they received a fertilizer treatment of 15-30-15 NPK. The plants were kept in the greenhouse for one week after transplant, after which they were moved to an outdoor shade house. They were watered, weeded and fertilized as needed.
One week before the first treatment, all plants were treated with a 1% concentrated soap spray to remove any insects that might be on the plants. The plants were randomly assigned one of two treatments: insecticide or water. They were sprayed until wet but not dripping in a spray chamber and then moved to a greenhouse bench. The plants received a second treatment two weeks later. Two days before the second treatment, all plants again were treated with a 1% concentrated soap spray to remove any insects that might be on the plants. The plants were harvested two weeks after the second treatment and dried for one week at 40 degrees C to constant weight in paper bags, and then were weighed.
The effect of treatment on biomass was analyzed in JMP. The insecticide neither increased nor decreased plant biomass (F1, 66 = 0.20, P = 0.66).
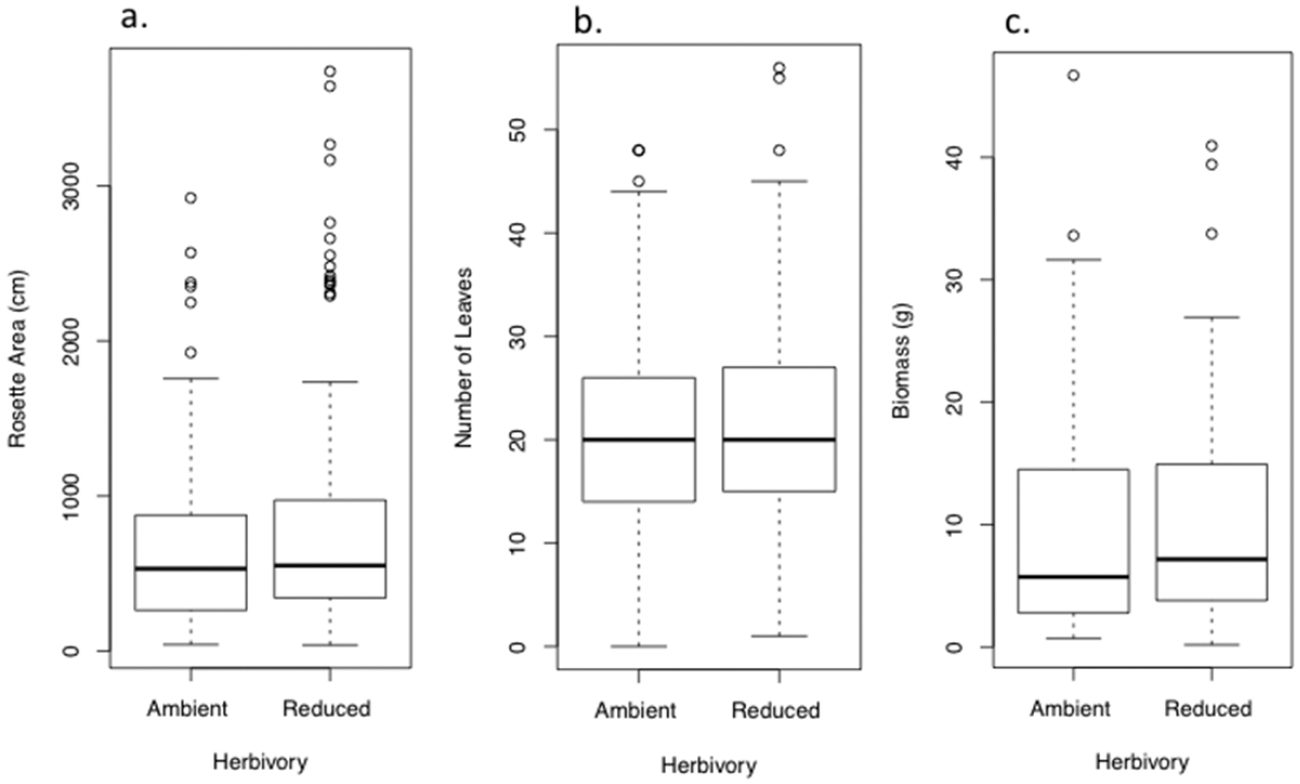
Box - and - whisker plots illustrating aspects of rosette size of Verbascum thapsus at the end of one field season of treatment (the plants’ first growing season), corresponding to Figure 1. Panels show A final rosette area B number of leaves and C biomass.
Box - and - whisker plots showing the characteristics of bolting plants after one field season of treatment (the plants’ second growing season), corresponding to Figure 2. Panels show A plant height and B inflorescence length.
Box - and - whisker plots showing performance after two field seasons of treatment, corresponding to Figure 3. Panels show A plant height B inflorescence length, and C seed production of those plants that reproduced.
Supplemental Anova Tables. Source indicates the different factors in the analysis. DDF is denominator degrees of freedom, NDF is numerator degrees of freedom, F values and P values are also provided. See text for additional details.
Rosette area, 2009 (treated 1 season).
| Source | DDF | NDF | F | P |
|---|---|---|---|---|
| Treatment | 1 | 332.66 | 5.10 | 0.025 |
| Cover | 1 | 336.04 | 2.56 | 0.111 |
| Initial Area | 1 | 336.86 | 14.28 | 0.000 |
| Avg. Herbivory | 1 | 333.65 | 4.60 | 0.033 |
| Avg. Herbivory × Treatment | 1 | 330.66 | 0.00 | 0.998 |
Number of leaves, 2009 (treated 1 season).
| Source | DDF | NDF | F | P |
|---|---|---|---|---|
| Treatment | 1 | 345.40 | 0.78 | 0.377 |
| Cover | 1 | 344.28 | 0.05 | 0.825 |
| Initial Area | 1 | 348.94 | 23.80 | <.0001 |
| Avg. Herbivory | 1 | 346.79 | 1.36 | 0.245 |
| Avg. Herbivory × Treatment | 1 | 343.18 | 2.91 | 0.089 |
Biomass of rosettes, 2009 (treated 1 season).
| Source | DDF | NDF | F | P |
|---|---|---|---|---|
| Treatment | 1 | 64.55 | 0.13 | 0.717 |
| Cover | 1 | 64.99 | 0.12 | 0.732 |
| Initial Area | 1 | 63.48 | 4.07 | 0.048 |
| Avg. Herbivory | 1 | 64.95 | 0.31 | 0.581 |
| Avg. Herbivory × Treatment | 1 | 63.21 | 0.58 | 0.450 |
Plant Height, Bolting plants 2009 (treated only their 2nd growing season).
| Source | DDF | NDF | F | P |
|---|---|---|---|---|
| Treatment | 1 | 91.13 | 7.03 | 0.009 |
| Cover | 1 | 85.25 | 0.56 | 0.456 |
| Initial Area | 1 | 77.98 | 58.64 | <.0001 |
| Avg. Herbivory | 1 | 71.69 | 13.37 | 0.001 |
| Avg. Herbivory × Treatment | 1 | 83.59 | 7.29 | 0.008 |
Total Inflorescence Length, Bolting plants 2009 (treated only their 2nd growing season).
| Source | DDF | NDF | F | P |
|---|---|---|---|---|
| Treatment | 1 | 95.45 | 3.17 | 0.078 |
| Cover | 1 | 96.76 | 4.48 | 0.037 |
| Initial Area | 1 | 96.20 | 66.26 | <.0001 |
| Avg. Herbivory | 1 | 96.48 | 10.45 | 0.002 |
| Avg. Herbivory × Treatment | 1 | 95.69 | 2.26 | 0.136 |
Plant Height, Bolting plants 2010 (treated both growing seasons).
| Source | DDF | NDF | F | P |
|---|---|---|---|---|
| Treatment | 1 | 235.33 | 10.99 | 0.001 |
| Cover 2009 | 1 | 237.75 | 0.52 | 0.470 |
| Cover 2010 | 1 | 210.71 | 1.78 | 0.184 |
| Initial Area | 1 | 236.72 | 7.23 | 0.008 |
| Avg. Herbivory | 1 | 236.26 | 11.20 | 0.001 |
| Avg. Herbivory × Treatment | 1 | 233.03 | 6.30 | 0.013 |
Total Inflorescence Length, Bolting plants 2010 (treated both growing seasons).
| Source | DDF | NDF | F | P |
|---|---|---|---|---|
| Treatment | 1 | 236.48 | 15.70 | <.0001 |
| Cover 2009 | 1 | 238.88 | 0.56 | 0.454 |
| Cover 2010 | 1 | 208.58 | 0.80 | 0.373 |
| Initial Area | 1 | 238.38 | 7.12 | 0.008 |
| Avg. Herbivory | 1 | 237.27 | 19.13 | <.0001 |
| Avg. Herbivory × Treatment | 1 | 233.98 | 1.26 | 0.263 |
Seed capsule density, Bolting plants 2010 (treated both growing seasons).
| Source | DDF | NDF | F | P |
|---|---|---|---|---|
| Treatment | 1 | 207.00 | 9.06 | 0.003 |
| Cover 2009 | 1 | 204.78 | 0.05 | 0.822 |
| Cover 2010 | 1 | 129.46 | 4.19 | 0.043 |
| Initial Area | 1 | 201.69 | 0.13 | 0.714 |
| Avg. Herbivory | 1 | 206.65 | 20.90 | <.0001 |
| Avg. Herbivory × Treatment | 1 | 204.13 | 12.34 | 0.001 |
Total No. of Seed Capsules, Bolting plants 2010 (treated both growing seasons).
| Source | DDF | NDF | F | P |
|---|---|---|---|---|
| Treatment | 1 | 203.24 | 22.58 | <.0001 |
| Cover 2009 | 1 | 204.77 | 1.68 | 0.196 |
| Cover 2010 | 1 | 191.22 | 0.08 | 0.777 |
| Initial Area | 1 | 204.86 | 2.74 | 0.099 |
| Avg. Herbivory | 1 | 203.53 | 30.09 | <.0001 |
| Avg. Herbivory × Treatment | 1 | 200.02 | 9.19 | 0.003 |