


(C) 2014 O. Thomas Lorenz. This is an open access article distributed under the terms of the Creative Commons Attribution License (CC BY 4.0), which permits unrestricted use, distribution, and reproduction in any medium, provided the original author and source are credited.
For reference, use of the paginated PDF or printed version of this article is recommended.
Citation: Lorenz OT, Smith P, Coghill L (2014) Condition and morphometric changes in tilapia (Oreochromis sp.) after an eradication attempt in Southern Louisiana. NeoBiota 20: 49–59. doi: 10.3897/neobiota.20.5062
A hybrid form of tilapia was introduced into Port Sulphur, Louisiana and was subsequently managed by treatment with rotenone and stocking of native predatory fishes. Measurements of tilapia from before this management event were compared to measurements of tilapia in the two years after the treatment. Post-management tilapia were consistently deeper in body and had greater weight per unit length (condition) when compared to pre-management fish. Procrustes generalized least squares data supported this by consistently finding post-management tilapia to be consistently deeper in body and head shape than pre-management fish. Although this could indicate the effectiveness of stocking native predators, several other factors, including two cold winters, seasonal effects, and less competition, may have contributed to this result.
Ivasive, tilapia, morphology, eradication, cichlid
Previous work has shown that both natural and human impacts can change the morphology of populations.
Tilapia, in particular the genus Oreochromis, have been introduced extensively and are listed as one of the 100 worse invasive species in the world (Lowe et al. 2000). Eradication and understanding of their invasive biology is an important concern to protect biodiversity and local fisheries. Although tilapia are a common invasive, no study has examined morphological changes in invasive tilapia after eradication efforts. In Port Sulphur, Louisiana there was an introduction of an unknown tilapia species into a seven-mile canal system. Over one million invasive tilapia were killed by rotenone treatment in the summer of 2009 in an eradication attempt monitored by Louisiana Department of Wildlife and Fisheries. No Largemouth Bass (Micropterus salmoides), gar (Lepisosteidae), or other species capable of eating an adult tilapia were collected after the rotenone treatment. One month after rotenone treatments, a variety of predatory fish were then stocked by LDWF and a monitoring program was put in place for the next several years. Ten tilapia were collected during the next two years and then they were not observed for two more years, from April 2011 until at least February of 2013 (Lorenz, unpublished data). The tilapia collected after rotenone treatment and predator stocking were noticeably unique in appearance, apparently with a deeper body.
Of note,
Twenty pre-management tilapia were collected by the initial rotenone treatment (2009), and ten post-management tilapia were collected by electrofishing (2010). Electrofishing was performed in the identical location to where fish were sampled before rotenone, within 100 meters of where the canal passes under Highway 23, north of Port Sulphur, Louisiana (29°31'29.87"N, 89°44'49.89"W). Standard length (SL) of each fish was measured to the nearest 0.1 cm on a Wildco fish measuring board, and body mass (BM) was weighed to the nearest 0.1 g on a Ohaus Navigator portable scale. Body depth was also measured to the nearest 0.1cm and all specimens were photographed by a digital camera (Pentax K-10D).
Two different analysis of covariance (ANCOVA) tests were performed to compare fish pre and post management. Each measurement (standard length, body depth, and weight) was log10-transformed prior to analysis for allometric scaling. The predictor variables for both ANCOVAs were standard length and a factor designating whether each individual fish was pre or post management (hereafter referred to as year). The first ANCOVA weight as a response variable and the second used body depth as a response variable. The design of these tests was to see if year was a significant predictor for either response variable with standard length as a covariate (α=0.05). Each model initially included an interaction between year and standard length. If the interaction term was not statistically significant (at α=0.05), it was removed. The ANCOVAs were created using R statistical software package version 2.12.1 (
Standardized photographs of individuals were entered into TPSDig2 where 15 landmarks were placed on each individual to generate the x and y coordinates used for further analyses (
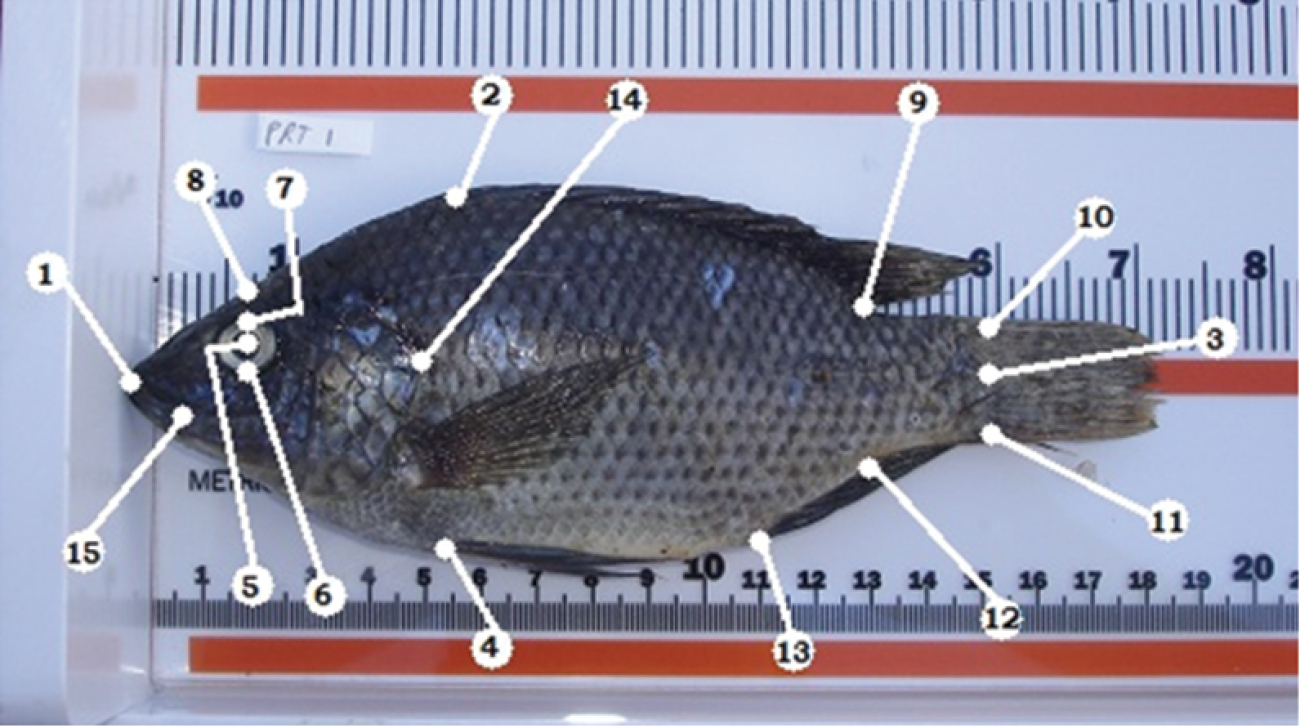
Description of the landmarks. 1 tip of snout at fold anterior to ethmoid/nasal bones, with mouth closed 2 anterior base of dorsal fin 3 base of the caudal fin at the level of the lateral line 4 anterior base of the anal fin 5 center of the eye 6 bottom of the eye 7 top of the eye 8 edge of the head directly above the center of the eye 9 posterior end of the dorsal fin base 10 base of the caudal fin, dorsal 11 base of the caudal fin, ventral 12 posterior end of the anal fin base 13 anterior end of the anal fin base 14 most posterior edge of operculum 15 corner of the mouth, where maxillary angle rests when the mouth is closed
The Procrustes coordinates were then used to generate principal components (PCs). A multivariate analysis of covariance (MANCOVA) design was then implemented with two covariates, and year as predictor variables. The response variable of this model was all PC components with an eigenvalue > 1 (PC1 – PC5), accounting for 82% of the variance. Previously, centroid size alone has been used as a covariate for similar MANCOVAs, but in this case it was also found to be correlated with standard length (
A between groups PCA (bgPCA) was also performed. We modified the bgPCA section of the ordination program for R statistical software found in Zeldich et al. (2012) for this part. To remove the effects of centroid size and standard length, residuals from a multivariate regression were used (Shape ~ centroid size + standard length). The deformation along the first PC axis was plotted for each coordinate as this has been suggested as a preferred method for interpreting the change in shape data between groups (
All analyses after generation of Procrustes coordinates were performed using R statistical software, unless otherwise noted (
An interaction between standard length and year was not found to be a significant predictor of weight (ANCOVA, d.f = 1, 26; F = 0.10; P =0.760) or body depth (ANCOVA, d.f. = 1, 26; F = 0.06; P = 0.815), therefore it was excluded from the reduced model for both response variables. The covariate standard length was found to be significant for both the weight and the body depth ANCOVAs (ANCOVA; d.f. = 1, 27; F = 1041, P < 0.001; ANCOVA; d.f. = 1, 27; F= 539; P < 0.001; respectively). Weight was found to be significantly different between year groups (ANCOVA; d.f. = 1, 27; F = 109; P < 0.001). Body depth was also found to be significantly different between year groups (ANCOVA; d.f. = 1, 27; F = 67; P < 0.001). The relationship between both predictor variables and standard length were plotted as a scatter plot. Lines of best fit from a linear regression were fit to fish from 2009 and 2010. These plots show that both weight and body depth were higher for fish collected post management (2010) than pre management (2009; Figs 2 and 3).
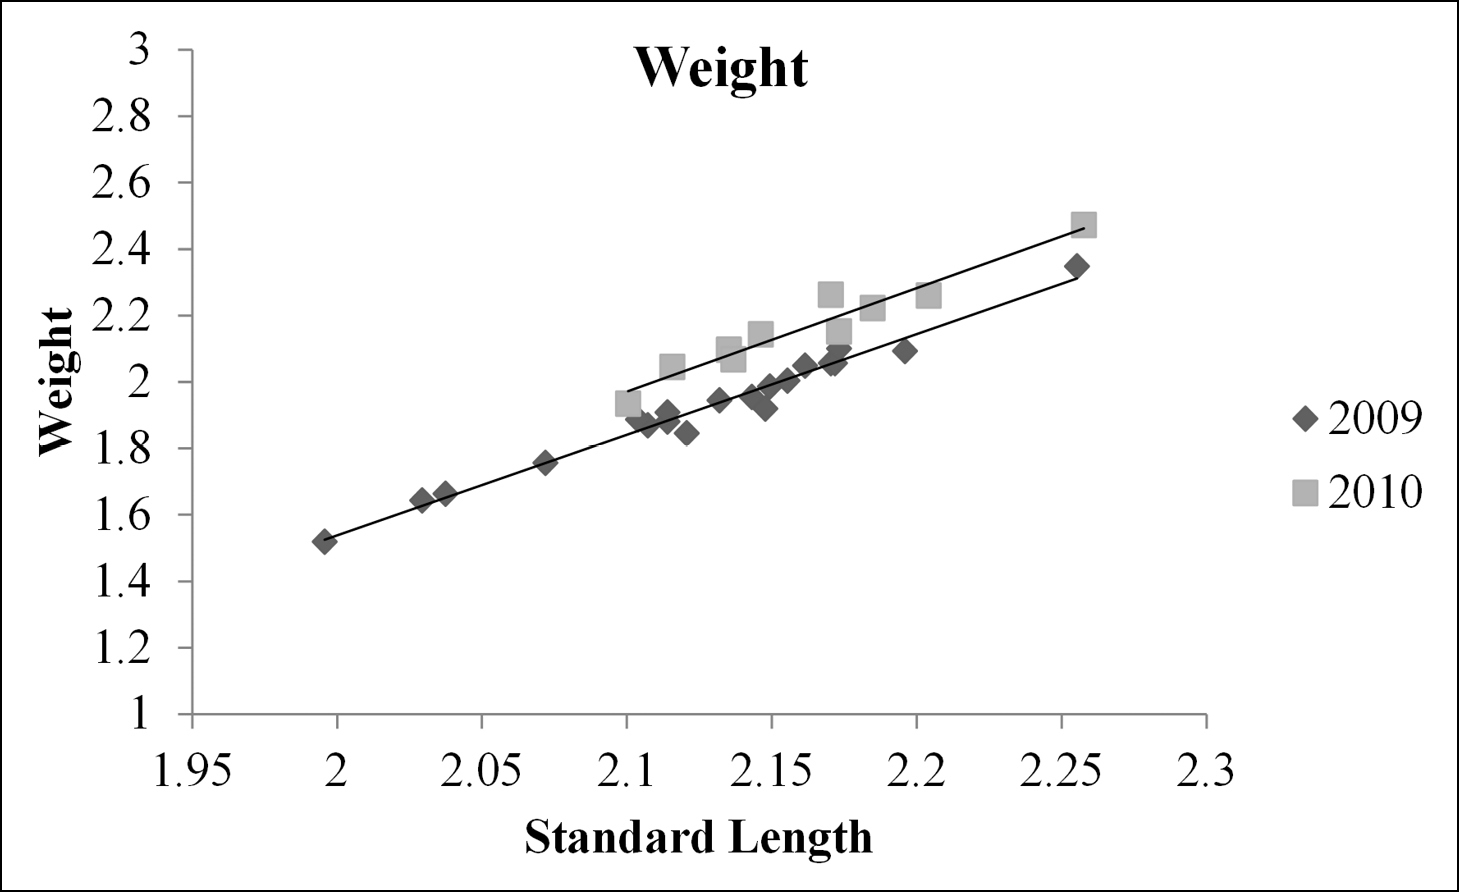
Relationship between log transformed standard length and log transformed weight as a scatter plot for fish from pre and post management (2009 and 2010, respectively). Two lines of best fit were created, one for each year group. The regression function for 2009 was y = -3.03x – 4.53, and was y = -3.12x – 4.57 for 2010, where y is log10 transformed weight in grams and x is log10 transformed standard length in mm.
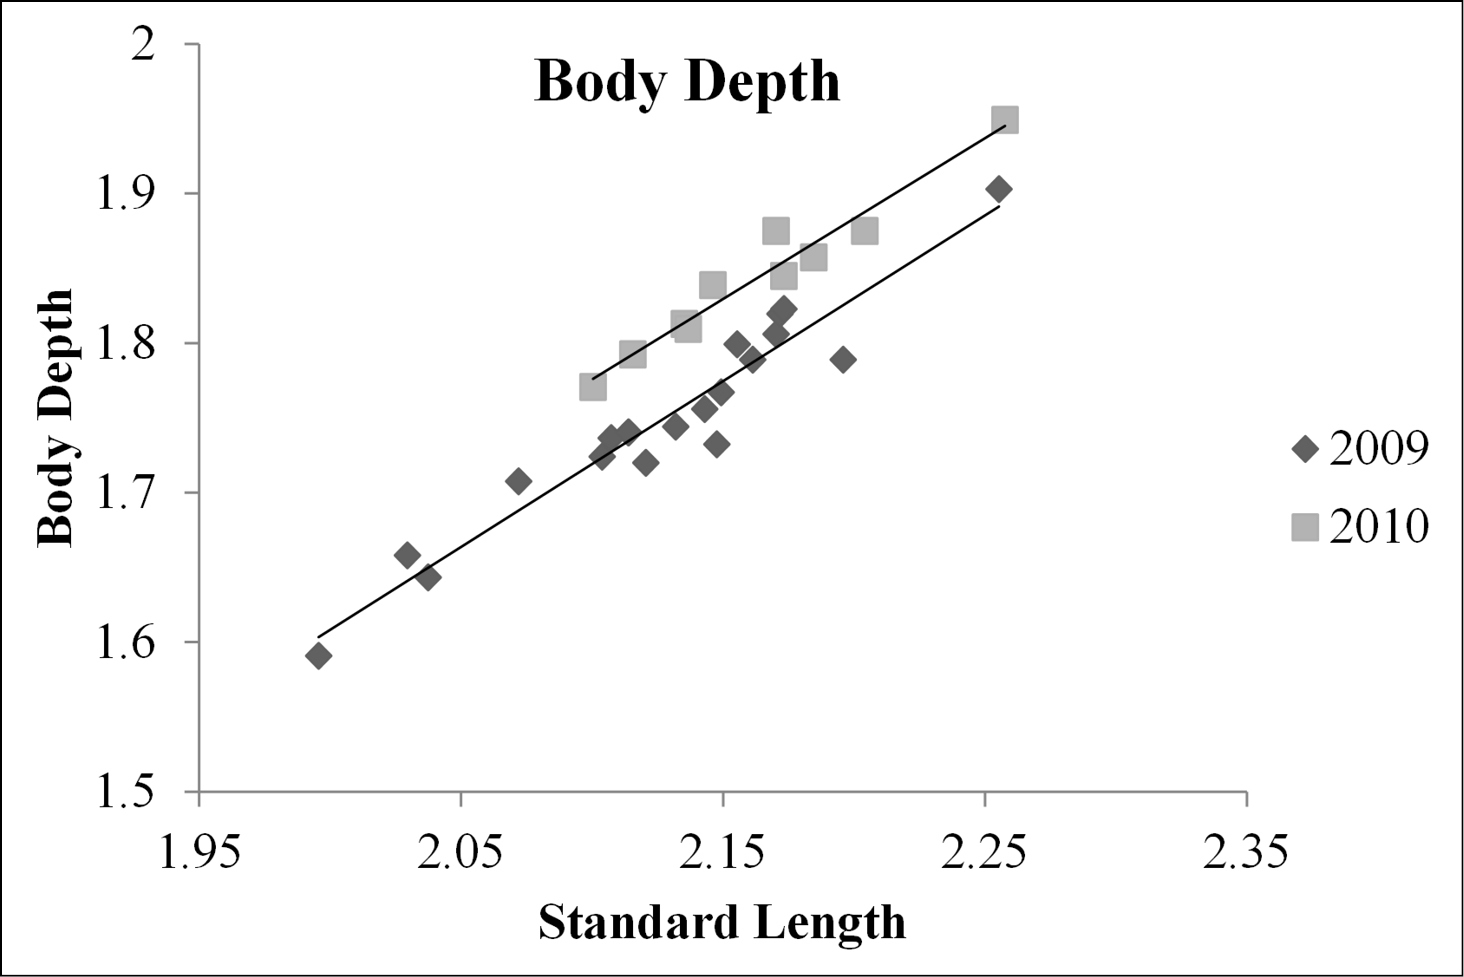
Relationship between log transformed standard length (x-axis) and log transformed body depth (y-axis) as a scatter plot for fish from pre and post management (2009 and 2010, respectively). Two lines of best fit were created, one for each year group. The regression function for 2009 was y = 1.11x – 0.61, and was y = 1.08x – 0.48 for 2010, where y is log10 transformed body depth in mm and x is log10 transformed standard length in mm.
The step-wise model reduction of the MANCOVA indicated there were no significant interactions included in our model (all P values > 0.05). Using both centroid size and standard length as covariates, year bins were significantly different with respect to Procrustes coordinates (d.f = 5, 22; F = 8.9; P < 0.001; Table 1). These data suggests that variation between years is still apparent and it aligns along the first PC axis which explains 35% of the total variation in shape among measured fish. Figure 4 shows representative fish from 2009 and 2010.
Table showing the results of the MANCOVA performed on shape for year bins.
| Effect | df | Pillai | F | P |
|---|---|---|---|---|
| Standard length | 5, 22 | 0.73 | 11.9 | < 0.001 |
| Centroid size | 5, 22 | 0.74 | 12.8 | < 0.001 |
| Year | 5, 22 | 0.67 | 8.9 | < 0.001 |
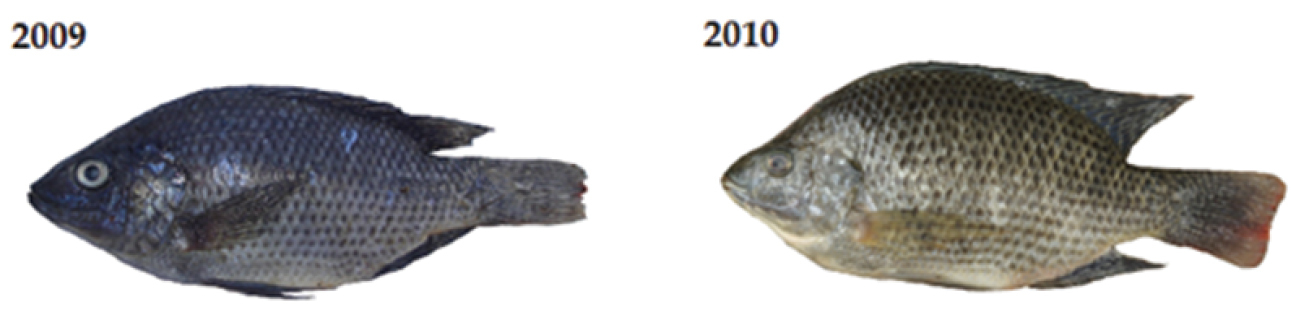
Representative fish from 2009 and 2010.
Figure 5 shows the deformation along PC1 of the bgPCA and illustrates marked differences between year categories. Procrustes coordinates near the anterior end of the fish are drawn in a posterior direction, while Procrustes coordinates at the anterior end of the dorsal and anal fins shift outward dorsoventrally and toward the anterior of the fish (Figure 5). This suggests the fish are becoming taller in body depth and shorter in overall length between year classes.
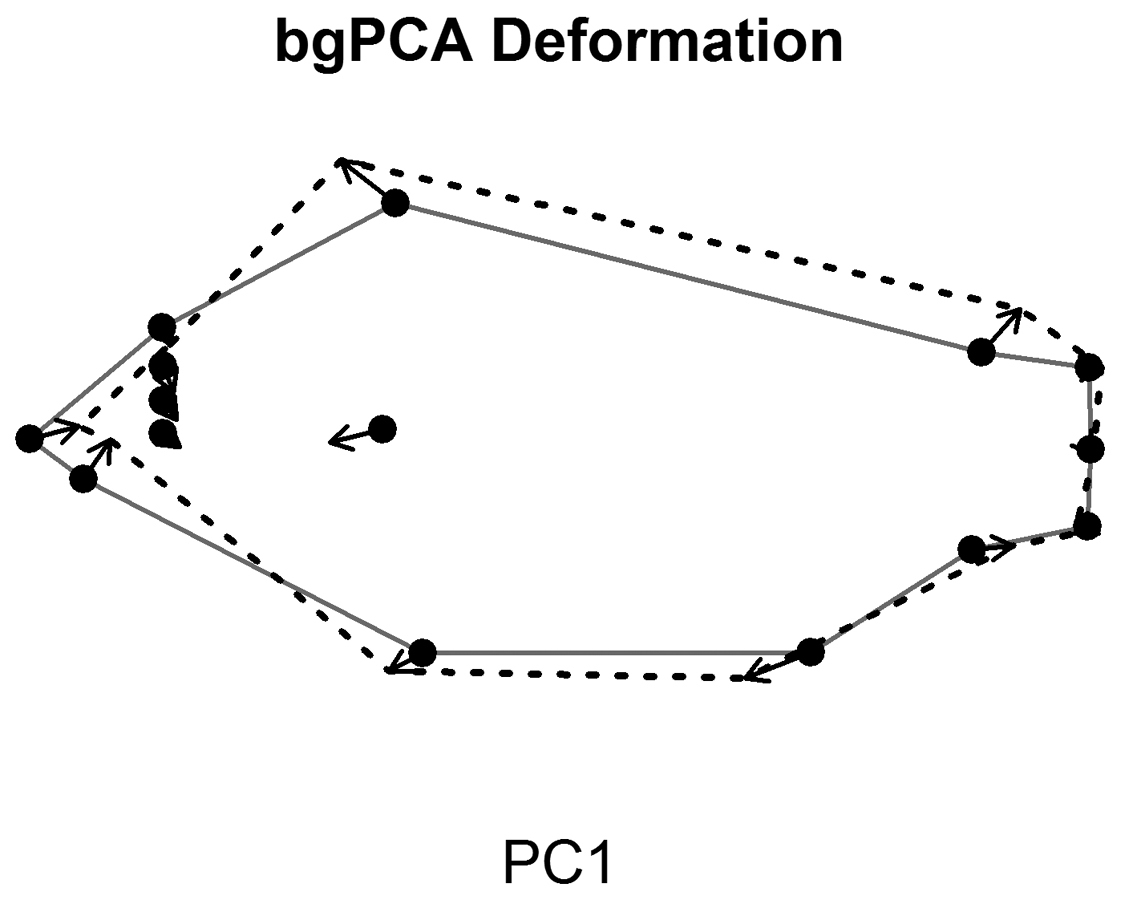
This figure shows the deformation along the first principal component (PC) of a between groups principal components analysis (bgPCA; between year groups). The principal components were calculated from the residuals of a multivariate regression (see Materials and Methods for more details). The solid line and points represents the mean shape of the Procrustes coordinates and the dashed line is the change along PC1 of the bgPCA. The arrows show the change for each coordinate.
Results from both ANCOVAs and all geometric morphometric analyses suggest that tilapia from each year bin were morphologically distinct. Post-management fish had higher bodies and were heavier per unit length than pre-management fish. The nature of our study, as well as other natural experiments, makes determining casual agents difficult if not impossible. However, the results presented here indicate that some underlying process(es) between the rotenone treatment in 2009 and 2010 caused significant changes in the morphology of tilapia from our study area.
Many possible reasons could explain this change in morphology. This apparent change in morphology could be an indicator of the success of the management plan stocking native predators. Past studies have shown that stocked predators can cause a change in the morphology of their prey (
After rotenone treatment there was a dramatic decrease in fish density and a clear decrease in tilapia abundance. While this is the desired effect of this method of management, it also reduces the level of competition in this habitat. Multiple tilapia could easily be caught with a blind throw of a cast net before the rotenone treatment (Lorenz pers. obs.). This sort of density can create stunting in fish, and stunting often has the opposite morphological effect of predators (
Breeding condition may also be a factor, as tilapia have been shown to have a change in body condition (and presumably morphology) depending on season (
The relatively rapid response (possibly one generation) may indicate a stronger influence of either plasticity or a bottleneck effect as opposed to selection. There is a high probability of a founder event occurring in this closed and heavily monitored system. Founder effects are a part of invasive species biology, and this population likely had multiple founder effects (the original introduction and the dramatic decrease in individuals post-rotenone). However, a stochastic event such as the rotenone treatment was also a likely selective event on the phenotypes of the surviving fish. Morphology has been shown to change as a result of bottleneck events in fish (
Invasive species are a serious threat, in part because they can be phenotypically plastic (Davidson et al. 2011) and can induce morphological changes in native species (Phillips and Shine 2006). Examining these changes can indicate the adaptability and impact of invasive species. If these changes can also indicate the success or unintended impact of management practices, there is a tremendous potential benefit. Tilapia from Port Sulphur changed significantly in morphology between pre and post-management year groups, and this change may have occurred because of the predators intentionally introduced to control their population. Further experiments could eliminate other reasons for such a change in morphology and determine if the predators were the most likely cause for the morphological changes observed. Using predatory game fish for management of invasive species can be successful, as seen with the reduction of invasive alewife (Alosa pseudoharengus) by introduced Pacific salmon (Oncorhynchus spp.) in Lake Michigan (
This study was possible because of a grant from the Louisiana Department of Wildlife and Fisheries acquired by the first author and M O’Connell, University of New Orleans. LDWF employees M. Kaintz and T. Ruth aided in providing specimens for examination. This manuscript represents publication No. 12 for the Nekton Research Laboratory, Pontchartrain Institute for Environmental Sciences.