Research Article |
|
Corresponding author: Songlin Fei ( sfei@purdue.edu ) Academic editor: José Hierro
© 2018 Basil V. Iannone III, Kevin M. Potter, Qinfeng Guo, Insu Jo, Christopher M. Oswalt, Songlin Fei.
This is an open access article distributed under the terms of the CC0 Public Domain Dedication.
Citation:
Iannone BV III, Potter KM, Guo Q, Jo I, Oswalt CM, Fei S (2018) Environmental harshness drives spatial heterogeneity in biotic resistance. NeoBiota 40: 87-105. https://doi.org/10.3897/neobiota.40.28558
|
Abstract
Ecological communities often exhibit greater resistance to biological invasions when these communities consist of species that are not closely related. The effective size of this resistance, however, varies geographically. Here we investigate the drivers of this heterogeneity in the context of known contributions of native trees to the resistance of forests in the eastern United States of America to plant invasions. Using 42,626 spatially referenced forest community observations, we quantified spatial heterogeneity in relationships between evolutionary relatedness amongst native trees and both invasive plant species richness and cover. We then modelled the variability amongst the 91 ecological sections of our study area in the slopes of these relationships in response to three factors known to affect invasion and evolutionary relationships –environmental harshness (as estimated via tree height), relative tree density and environmental variability. Invasive species richness and cover declined in plots having less evolutionarily related native trees. The degree to which they did, however, varied considerably amongst ecological sections. This variability was explained by an ecological section’s mean maximum tree height and, to a lesser degree, SD in maximum tree height (R2GLMM = 0.47 to 0.63). In general, less evolutionarily related native tree communities better resisted overall plant invasions in less harsh forests and in forests where the degree of harshness was more homogenous. These findings can guide future investigations aimed at identifying the mechanisms by which evolutionary relatedness of native species affects exotic species invasions and the environmental conditions under which these effects are most pronounced.
Keywords
Environmental harshness, environmental variability, evolutionary divergence, forests, invasive plants, phylogeny, relative tree density
Introduction
Observations across large geographic areas reveal considerable spatial heterogeneity in the degree to which ecological communities are invaded by non-native species (
Analyses of the same large-scale forest data have also revealed evidence that native tree communities contribute to the ability of forests to resist plant invasions in general, i.e. regardless of invader growth form, and that these contributions vary spatially (
The objective of this investigation was to determine the degree to which environmental characteristics of forests drive spatial heterogeneity in the effects that native tree evolutionary relatedness has on overall forest plant invasions. This investigation was conducted in the forests of the eastern United States of America (USA). We pursue this objective in the context of three separate characteristics of evolutionary relatedness: how divergent (sensu
Methods
Evolutionary relatedness and biotic resistance
Evolutionary relatedness is typically defined within the context of phylogenetic relatedness or the locations of species relative to one another across a phylogenetic tree that describes the hypothesised evolutionary relationships amongst species. Many studies investigating the effects of phylogenetic relatedness on invasion have done so in the context of the evolutionary relatedness between invasive and native species, i.e. within the context of “Darwin’s naturalisation hypothesis” that species from novel genera may have an advantage when invading new locations because they are less likely to compete with closely related species or share natural enemies with them (e.g.
Data compilation
To meet our objective, we first obtained native tree and invasive plant data from 42,626 forested plots from the United States Department of Agriculture’s Forest Inventory and Analysis programme (FIA) located within the two ecological domains (sensu
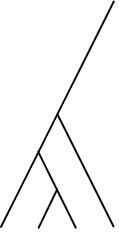
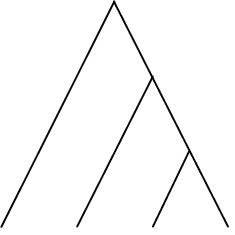
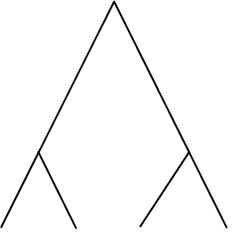
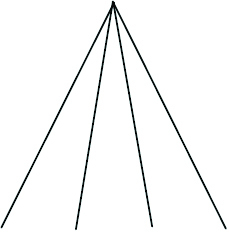
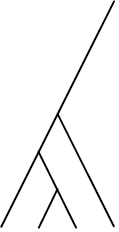
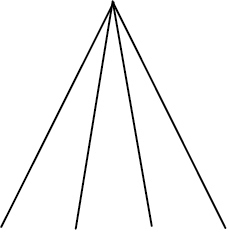
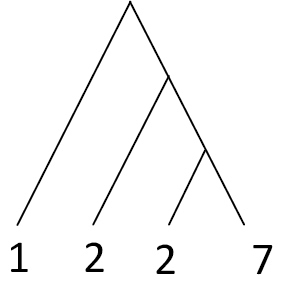
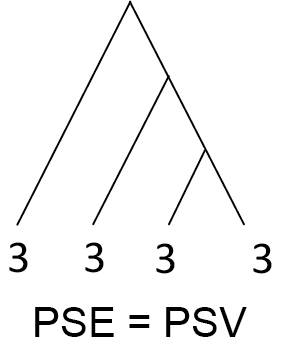
We used four metrics (Table
Explanation of the four investigated metrics of evolutionary relatedness. PD is defined by
| Metric | Definition of metrics & notes | Lower | Higher |
|---|---|---|---|
| Phylogenetic species clustering (PSC) | Quantifies the degree to which phylogenetic branch tips are divergent or clustered relative to one another. Ranges from 0 (low divergence) to 1 (high divergence) |
|
|
| Phylogenetic species variability (PSV) | Quantifies variability amongst species in a hypothetical neutral trait and thus divergence across the branch lengths of a phylogeny. Ranges from 0 (low) to 1 (high, star phylogeny) |
|
|
| Phylogenetic diversity (PD) | Summed lengths of phylogenetic branches. Values increase with species richness. Positive value has no upper limit. Increases with greater values |
|
|
| Phylogenetic species evenness (PSE) | Hypothesised to reflect evenness in traits and phenotypic variation. PSE = PSV when all species are equally abundant and declines with greater differences in abundance. NOTE: Numbers at branch tips on the right signify number of individuals |
|
|
A benefit of using PSV, PSC and PSE is that these metrics of phylogenetic divergence do not require prior knowledge of the regional species pool from which species could populate a plot (
We assessed overall plant invasion in each plot by compiling data on invasive plant richness and cover data, following
Confirming/quantifying spatial variability in invasion resistance
Using a mixed-effects modelling framework developed by
Identifying drivers of spatial heterogeneity in invasion resistance
We compiled data from the FIA database on plot-level maximum tree height (m) and relative tree density. Maximum tree height was used as an inverse indicator of environmental harshness.
We conducted preliminary regression analyses to assess the degree to which maximum tree height, relative tree density and SD in these variables predicted forest age. We did so to rule out the possibility of our findings reflecting nothing more than forest successional stages, i.e. variation between young and old forests in the degree of invasion. Both maximum tree height and relative tree density explained relatively small proportions of variability in FIA estimates of forest stand age at both the individual plot and ecological section levels (range in R2 = 0.04 to 0.24). SD of maximum tree height and relative density also explained relatively small proportions of forest stand age (R2= 0.25 and 0.04, respectively). These low R2 values revealed that mean and SD of maximum tree height and relative density were largely indicative of environmental conditions other than forest successional stages.
We modelled slope estimates for relationships between phylogenetic metrics indicative of biotic resistance and invasive richness and cover in each of the 91 ecological sections (determined as described above) in response to the section-level mean and SD of maximum tree height and relative tree density, as well as section-level estimates of mean Jaccard’s distance (model shown in Table
Prior to analysis, we standardised explanatory variables [x – mean(x)/SD(x)], allowing us to assess the relative contribution of each to this spatial heterogeneity (
Statistical analyses were conducted in R v 3.0.1 (
Results
Spatial heterogeneity in invasion resistance
Mapping the section level slope estimates determined via mixed-effects modelling confirmed spatial variability in relationships between phylogenetic (PSC, PSV, PD and PSE) and invasion (richness and cover) metrics (Fig.

Drivers of spatial heterogeneity in biotic resistance to invader establishment (i.e. invasive richness)
Spatial variability in the degree to which both PSC and PSV were related to invasive richness was largely explained by mean and SD maximum tree height (Table

Effects of mean and SD maximum tree height in 91 ecological sections on the degree to which PSC (A, B) and PSV (C, D) affect invasive species richness (i.e. slope values for these relationships). Note that values on x and y axes were transformed (z-transformed and [(x + abs(min(x)) + 1)7], respectively) prior to analysis. Untransformed values for slopes were largely negative (Fig.
Drivers of spatial heterogeneity in biotic resistance to invader dominance (i.e. invasive cover)
Spatial variability in the degree to which both PSC and PSV were related to invasive cover was explained solely by mean maximum tree height (Table

Effects of mean maximum tree height in 91 ecological sections on the degree to which PSC (A) and PSV (B) affect invasive species cover (i.e. slope values for these relationships). Note that values on x and y axes were transformed (z-transformed and [(x + abs(min(x)) + 1)7], respectively) prior to analysis. Untransformed values for slopes were largely negative (Fig.
Results of linear mixed-effects models. These models were used to determine the relative contribution of mean and SD of maximum tree height and relative tree density, as well as mean Jaccard’s distance, to spatial heterogeneity in relationships between metrics of phylogenetic divergence (PSC and PSV) and invasion (invasive richness and cover). Models contained ecological provinces as a random effect.
| Dependent variable | Explanatory variables | |||||
|---|---|---|---|---|---|---|
| Section-level | Mean Max | SD Max | Mean | SD | Mean | |
| slope estimates for: | tree ht. | tree ht. | Rel. density | Rel. density | Jaccard’s dist. | R2GLMM |
| Invasive richness ~ PSC | -2.66 ± 0.54**** | 1.29 ± 0.55* | 0.83 ± 0.60 | -0.24 ± 0.42 | -0.73 ± 0.50 | 0.55 |
| Invasive richness ~ PSV | -2.18 ± 0.59*** | 1.71 ± 0.60** | 0.86 ± 0.66 | -0.55 ± 0.46 | -0.75 ± 0.55 | 0.47 |
| Invasive cover ~ PSC | -6.64 ± 1.17**** | 0.07 ± 1.19 | 1.94 ± 1.31 | 0.62 ± 0.91 | -0.21 ± 1.09 | 0.63 |
| Invasive cover ~ PSV | -1.18 ± 0.29*** | 0.16 ± 0.29 | 0.37 ± 0.32 | 0.04 ± 0.22 | -0.08 ± 0.27 | 0.49 |
Spatial context
Follow-up mapping of section-level estimates of statistically signification explanatory variables shown in Table

Discussion
We found evidence that environmental harshness and, to a lesser degree, variability in environmental harshness drive spatial heterogeneity in the contribution of phylogenetic divergence (PSC and PSV) of native trees to biotic resistance to overall plant invasions in eastern USA forests. While spatial heterogeneity in the contribution of native trees to biotic resistance to forest plant invasions was previously noted (
In contrast to phylogenetic divergence, we found no evidence that the amount of evolutionary history (i.e. PD) or the evenness at which these native tree species occur across a given community’s phylogenetic tree (i.e. PSE) contribute to biotic resistance across macroscales. The consistently positive associations that PD and PSE shared with both invasive richness and cover suggests these metrics to be more indicative of niche availability than biotic resistance, at least at the spatial scale of our investigation. The weak magnitudes of these associations also revealed them to be of little value in predicting macroscale invasion patterns. The positive association between PD and invasion was not surprising, as this metric is strongly related to native species richness, which itself is positively related to invasive richness and cover at large spatial scales (
By revealing factors that affect the strength of relationships between phylogenetic divergence and invasion, our study revealed conditions under which phylogenetic divergence of native tree communities likely contributes most to invasion resistance in forest ecosystems. Standardised slope estimates revealed that mean maximum tree height was the explanatory variable having the greatest effect. This factor was negatively correlated with slope values for relationships between both PSC and PSV and both invasion richness and cover. Given that maximum tree height is an inverse measure of environmental harshness (
Increased environmental variability across large geographic areas can increase species richness (
The decline in the effects of phylogenetic divergence on invasion in ecological sections having more variable maximum tree height may reflect an increased number of locations having more harsh environments. That is, it indicates an increase in the number of locations where phylogenetic divergence affects invader establishment less. An increase in the number of locations experiencing canopy disturbance (natural or human) may also contribute to our finding regarding SD in maximum tree height given that increased light facilitates forest plant invasions (
We utilised two different measures of invasion — invasive species richness and cover — as both provide different perspectives on invasion patterns. Invasive richness is an indicator of invader establishment and invasive cover is an indicator of invader dominance. Prior theoretical and empirical investigations reveal the deeper understanding that can be gained by considering multiple invasion metrics simultaneously within the same investigation (
Identifying the factors that affect the ability of PSC and PSV to contribute to invasion resistance may also help to reveal how characteristics of evolutionary relationships (e.g. divergence, branch lengths and species evenness) emerge under different environmental conditions. For instance, both PSC and PSV limit invader establishment (as estimated by invasive richness) to greater degrees in forests that are less harsh. Therefore, the levels of environmental harshness found in a forest, by indirectly affecting invader establishment, have the potential to affect future PSC and PSV values for that forest. Therefore, our findings illustrate how knowing the phylogenetic relationships within an ecological community can help to understand the conditions from which these relationships emerge, i.e. the “phylogenetic-patterns-as-results utility” of known phylogenetic relationships (
Conclusions
We found evidence that environmental harshness and, to a lesser degree, spatial variability in environmental harshness, affect the ability of more phylogenetically divergent native tree communities to limit the establishment and dominance of invasive plants. Therefore, through indirect pathways, these factors may affect short-term invasion patterns and community-level change and, in so doing, affect the long-term characteristics of evolutionary relationships. Nevertheless, these factors did not explain all variability in phylogenetic-invasion relationships. Therefore, future investigations are needed. Considering how other known drivers of invasion patterns, such as propagule pressure and plant functional traits, as well as understorey native plant communities and forest soils, contribute to variability in the degree to which phylogenetic divergence of native trees contributes to invasion resistance, will likely be beneficial. Also needed is the determination of the component(s) of environmental harshness most contributing to our findings and the mechanisms by which phylogenetic divergence amongst native trees affects overall plant invasion. Controlled experiments replicated across our study region would greatly help in this regard. Such considerations will increase our understanding of how the evolutionary relatedness amongst species in a given community affects invasions and community change.
Data accessibility
Iannone BV III, Potter KM, Guo Q, Jo I, Oswalt CM, Fei S (2018) Data on native tree diversity (species richness and phylogenetic), biomass, relative density, tree height and invasive plants in forests of the eastern USA. Purdue University Research Repository.
https://purr.purdue.edu/publications/3072/1 doi: 10.4231/R7GX48TW.
Acknowledgements
Thanks to the many Forest Inventory and Analysis workers who collected the data used in this study and to Beth Schulz, Andrew Gray and Chris Witt for helping to compile data. This study was supported by National Science Foundation Macrosystems Biology grants #1241932 and #1638702 and by Cost Share Agreement 14-CS-11330110-042 between the United States Department of Agriculture Forest Service and North Carolina State University.
References
- Bartoń K (2014) MuM. In: multi-model inference. R package version 1.10.0. http://cran.r-project.org/package=MuMIn.
- Bechtold WA, Patterson PL (2005) The enhanced forest inventory and analysis program - national sampling design and estimation procedures. General Technical Report SRS-80. U.S. Department of Agriculture, Forest Service, Southern Research Station, Asheville.
- Bertness MD, Callaway R (1994) Positive interactions in communities. Trends in Ecology & Evolution 9: 191–193. https://doi.org/10.1016/0169-5347(94)90088-4
- Catford JA, Vesk PA, Richardson DM, Pyšek P (2012) Quantifying levels of biological invasion: towards the objective classification of invaded and invasible ecosystems. Global Change Biology 18: 44–62. https://doi.org/10.1111/j.1365-2486.2011.02549.x
- Cleland DT, Avers PE, McNab WH, Jensen ME, Bailey RG, King T, Russell WE (1997) National hierarchical framework of ecological units. In: Boyce MS, Haney A (Eds) Ecosystem Management Applications for Sustainable Forest and Wildlife Resources.Yale University Press, New Haven, 181–200.
- Davies KF, Chesson P, Harrison S, Inouye BD, Melbourne BA, Rice KJ (2005) Spatial heterogeneity explains the scale dependence of the native-exotic diversity relationship. Ecology 86: 1602–1610. https://doi.org/10.1890/04-1196
- Diez JM, Sullivan JJ, Hulme PE, Edwards G, Duncan RP (2008) Darwin’s naturalization conundrum: dissecting taxonomic patterns of species invasions. Ecology Letters 11: 674–681. https://doi.org/10.1111/j.1461-0248.2008.01178.x
- Dixon Hamil K, Iannone BV III, Huang W, Fei S, Zhang H (2016) Cross-scale contradictions in ecological relationships. Landscape Ecology 31: 7–18. https://doi.org/10.1007/s10980-015-0288-z
- Efron B, Tibshirani R (1986) Bootstrap methods for standard errors, confidence intervals, and other measures of statistical accuracy. Statistical Science 1: 54–75. https://doi.org/10.1214/ss/1177013815
- Eschtruth AK, Battles JJ (2009) Assessing the relative importance of disturbance, herbivory, diversity, and propagule pressure in exotic plant invasion. Ecological Monographs 79: 265–280. https://doi.org/10.1890/08-0221.1
- Faith DP (1992) Conservation evaluation and phylogenetic diversity. Biological Conservation 61: 1–10. https://doi.org/10.1016/0006-3207(92)91201-3
- Fridley JD, Stachowicz JJ, Naeem S, Sax DF, Seabloom EW, Smith MD, Stohlgren TJ, Tilman D, Holle BV (2007) The invasion paradox: reconciling pattern and process in species invasions. Ecology 88: 3–17. https://doi.org/10.1890/0012-9658(2007)88[3:TIPRPA]2.0.CO;2
- Gerhold P, Cahill Jr JF, Winter M, Bartish IV, Prinzing A (2015) Phylogenetic patterns are not proxies of community assembly mechanisms (they are far better). Functional Ecology 29: 600–614. https://doi.org/10.1111/1365-2435.12425
- Gerhold P, Partel M, Tackenberg O, Hennekens SM, Bartish I, Schaminee JHJ, Fergus AJF, Ozinga WA, Prinzing A (2011) Phylogenetically poor plant communities receive more alien species, which more easily coexist with natives. The American Naturalist 177: 668–680. https://doi.org/10.1086/659059
- Gonzalez P, Hasson R, Lakyda P, McCallum I, Nilsson S, Pulhin J, van Rosenberg B, Scholes B, Shvidenko A, Barber CV, Persson R (2005) Forest and woodland systems. In: Hassan R, Scholes R, Ash N (Eds) Millennium Ecosystem Assessment: Ecosystems and Human Well-being: Current State & Trends Assessment.Island Press, Washington, DC, 585–621.
- Guo Q, Fei S, Dukes JS, Oswalt C, Iannone BV III, Potter KM (2015) A unified approach for quantifying invasibility and degree of invasion. Ecology 96: 2613–2621. https://doi.org/10.1890/14-2172.1
- Guo Q, Symstad A (2008) A two-part measure of degree of invasion for cross-community comparisons. Conservation Biology 22: 666–672. https://doi.org/10.1111/j.1523-1739.2008.00915.x
- Helmus MR, Bland TJ, Williams CK, Ives AR (2007) Phylogenetic measures of biodiversity. The American Naturalist 169: E68–E83. https://doi.org/10.1086/511334
- Hillebrand H, Bennett DM, Cadotte MW (2008) Consequences of dominance: a review of evenness effects of local and regional ecosystem processes. Ecology 89: 1510–1520. https://doi.org/10.1890/07-1053.1
- Iannone BV III, Oswalt CM, Liebhold AM, Guo Q, Potter KM, Nunez-Mir GC, Oswalt SN, Pijanowski BC, Fei S (2015) Region-specific patterns and drivers of macroscale forest plant invasions. Diversity and Distributions 21: 1181–1192. https://doi.org/10.1111/ddi.12354
- Iannone BV III, Potter KM, Dixon Hamil K, Huang W, Zhang H, Guo Q, Oswalt CM, Woodall CW, Fei S (2016) Evidence of biotic resistance to invasions in forests of the Eastern USA. Landscape Ecology 31: 85–99. https://doi.org/10.1007/s10980-015-0280-7
- Iannone BV III, Zellner ML, Wise DH (2013) Modeling the impacts of life-history traits, canopy gaps, and establishment location on woodland shrub invasions. Ecological Applications 24: 467–483. https://doi.org/10.1890/13-0833.1
- Johnson PCD (2014) Extension of Nakagawa & Schielzeth’s R2GLMM to random slopes models. Methods in Ecology and Evolution 5: 944–946. https://doi.org/10.1111/2041-210X.12225
- Kembel SW, Cowan PD, Helmus MR, Cornwell WK, Morlon H, Ackerly DD, Blomberg SP, Webb CO (2010) Picante: R tools for integrating phylogenies and ecology. Bioinformatics 26: 1463–1464. https://doi.org/10.1093/bioinformatics/btq166
- Kennedy TA, Naeem S, Howe KM, Knops JMH, Tilman D, Reich P (2002) Biodiversity as a barrier to ecological invasion. Nature 417: 636–638. https://doi.org/10.1038/nature00776
- Legendre P, Legendre L (2012) Numerical Ecology. Elsevier Science B.V., Amsterdam.
- Liebhold AM, McCullough DG, Blackburn LM, Frankel SJ, Von Holle B, Aukema JE (2013) A highly aggregated geographical distribution of forest pest invasions in the USA. Diversity and Distributions 19: 1208–1216. https://doi.org/10.1111/ddi.12112
- Lososová Z, de Bello F, Chytrý M, Kühn I, Pyšek P, Sádlo J, Winter M, Zelený D (2015) Alien plants invade more phylogenetically clustered community types and cause even stronger clustering. Global Ecology and Biogeography 24: 786–794. https://doi.org/10.1111/geb.12317
- Marks CO, Muller-Landau HC, Tilman D (2016) Tree diversity, tree height and environmental harshness in eastern and western North America. Ecology Letters 19: 743–751. https://doi.org/10.1111/ele.12608
- Martin PH, Canham CD, Marks PL (2009) Why forests appear resistant to exotic plant invasions: intentional introductions, stand dynamics, and the role of shade tolerance. Frontiers in Ecology and the Environment 7: 142–149. https://doi.org/10.1890/070096
- Muller RN (2003) Nutrient relations of the herbaceous layer in deciduous forest ecosystems. In: Gilliam FS, Roberts MR (Eds) The Herbaceous Layer in Forests of Eastern North America.Oxford University Press, New York, 15–37.
- Oswalt CM, Fei S, Guo QF, Iannone BV III, Oswalt SN, Pijanowski BC, Potter KM (2016) A subcontinental view of forest plant invasions. Neobiota 31: 105–106. https://doi.org/10.3897/neobiota.31.8785
- Pearson DE, Ortega YK, Eren O, Hierro JL (2018) Community assembly theory as a framework for biological invasions. Trends in Ecology & Evolution 33: 313–325. https://doi.org/10.1016/j.tree.2018.03.002
- Pejchar L, Mooney HA (2009) Invasive species, ecosystem services and human well-being. Trends in Ecology & Evolution 24: 497–504. https://doi.org/10.1016/j.tree.2009.03.016
- Pinheiro J, Bates D, DebRoy S, Sarkar D, R Core Team (2017) nlme: Linear and Nonlinear Mixed Effects Models. R package version 3. https://CRAN.R-project.org/package=nlme
- Potter KM (2018) Do United States protected areas effectively conserve forest tree rarity and evolutionary distinctiveness? Biological Conservation 224: 34–46. https://doi.org/10.1016/j.biocon.2018.05.007
- Potter KM, Woodall CW (2014) Does biodiversity make a difference? Relationships between species richness, evolutionary diversity, and aboveground live tree biomass across U.S. forests. Forest Ecology and Management 321: 117–129. https://doi.org/10.1016/j.foreco.2013.06.026
- Procheş Ş, Wilson JRU, Richardson DM, Rejmánek M (2008) Searching for phylogenetic pattern in biological invasions. Global Ecology and Biogeography 17: 5–10.
- Qian H, Ricklefs RE (2000) Large-scale processes and the Asian bias in species diversity of temperate plants. Nature 407: 180–182. https://doi.org/10.1038/35025052
- R Core Team (2014) R: A language and environment for statistical computing. R Foundation for Statistical Computing, Vienna, Austria. http://www.R-project.org.
- Ries P, Dix ME, Lelmini M, Thomas D (2004) National Strategy and Implementation Plan for Invasive Species Management. FS-805. U.S. Department of Agriculture, Forest Service,Washington, DC.
- Riitters K, Potter K, Iannone BV III, Oswalt CM, Fei S, Guo Q (2018) Landscape correlates of forest plant invasions: A high-resolution analysis across the eastern United States. Diversity and Distributions 24: 274–284. https://doi.org/10.1111/ddi.12680
- Schielzeth H (2010) Simple means to improve the interpretability of regression coefficients. Methods in Ecology and Evolution 1: 103–113. https://doi.org/10.1111/j.2041-210X.2010.00012.x
- Shea K, Chesson P (2002) Community ecology theory as a framework for biological invasions. Trends in Ecology & Evolution 17: 170–176. https://doi.org/10.1016/S0169-5347(02)02495-3
- Stohlgren T, Barnett D, Flather C, Fuller P, Peterjohn B, Kartesz J, Master L (2006) Species richness and patterns of invasion in plants, birds, and fishes in the United States. Biological Invasions 8: 427–447. https://doi.org/10.1007/s10530-005-6422-0
- Stohlgren TJ, Barnett DT, Kartesz JT (2003) The rich get richer: patterns of plant invasions in the United States. Frontiers in Ecology and the Environment 1: 11–14. https://doi.org/10.1890/1540-9295(2003)001[0011:TRGRPO]2.0.CO;2
- Tan J, Pu Z, Ryberg WA, Jiang L (2015) Resident-invader phylogenetic relatedness, not resident phylogenetic diversity, controls community invasibility. The American Naturalist 186: 59–71. https://doi.org/10.1086/681584
- Theoharides K, Dukes J (2007) Plant invasion across space and time: factors affecting nonindigenous species success during four stages of invasion. New Phytologist 176: 256–273. https://doi.org/10.1111/j.1469-8137.2007.02207.x
- Thuiller W, Gallien L, Boulangeat I, De Bello F, Münkemüller T, Roquet C, Lavergne S (2010) Resolving Darwin’s naturalization conundrum: a quest for evidence. Diversity and Distributions 16: 461–475. https://doi.org/10.1111/j.1472-4642.2010.00645.x
- Tibshirani R, Leisch F (2013) Bootstrap: Functions for the Book “An Introduction to the Bootstrap”. R package version. http://CRAN.R-project.org/package=bootstrap [2012.04-1]
- Tucker CM, Cadotte MW, Carvalho SB, Davies TJ, Ferrier S, Fritz SA, Grenyer R, Helmus MR, Jin LS, Mooers AO, Pavoine S, Purschke O, Redding DW, Rosauer DF, Winter M, Mazel F (2017) A guide to phylogenetic metrics for conservation, community ecology and macroecology. Biological Reviews 92: 698–715. https://doi.org/10.1111/brv.12252
- Webb CO, Ackerly DD, McPeek MA, Donoghue MJ (2002) Phylogenies and community ecology. Annual Review of Ecology and Systematics 33: 475–505. https://doi.org/10.1146/annurev.ecolsys.33.010802.150448
- Wilsey BJ, Polley HW (2002) Reductions in grassland species evenness increase dicot seedling invasion and spittle bug infestation. Ecology Letters 5: 676–684. https://doi.org/10.1046/j.1461-0248.2002.00372.x
Supplementary materials
Locations of Northern and Southern FIA Regions and of the ecological domains, provinces and sections in which study plots were located
Description of differences between Northern and Southern FIA Regions in invasive plant species monitoring protocols
Section-level standardised slope estimates for the 91 ecological sections from initial models of invasive richness and cover in response to four metrics of evolutionary relatedness—PSC, PSV, PD and PSE