|
Corresponding author: Martin Enders ( enders.martin@gmx.net ) Academic editor: Robert Colautti
© 2019 Martin Enders, Frank Havemann, Jonathan M. Jeschke.
This is an open access article distributed under the terms of the Creative Commons Attribution License (CC BY 4.0), which permits unrestricted use, distribution, and reproduction in any medium, provided the original author and source are credited.
Citation:
Enders M, Havemann F, Jeschke JM (2019) A citation-based map of concepts in invasion biology. NeoBiota 47: 23-42. https://doi.org/10.3897/neobiota.47.32608
|
Abstract
Invasion biology has been quickly expanding in the last decades so that it is now metaphorically flooded with publications, concepts, and hypotheses. Among experts, there is no clear consensus about the relationships between invasion concepts, and almost no one seems to have a good overview of the literature anymore. Similar observations can be made for other research fields. Science needs new navigation tools so that researchers within and outside of a research field as well as science journalists, students, teachers, practitioners, policy-makers, and others interested in the field can more easily understand its key ideas. Such navigation tools could, for example, be maps of the major concepts and hypotheses of a research field. Applying a bibliometric method, we created such maps for invasion biology. We analysed research papers of the last two decades citing at least two of 35 common invasion hypotheses. Co-citation analysis yields four distinct clusters of hypotheses. These clusters can describe the main directions in invasion biology and explain basic driving forces behind biological invasions. The method we outline here for invasion biology can be easily applied for other research fields.
Keywords
bibliometric methods, biological invasions, concepts, invasion biology, invasion science, map, navigation tools, network of invasion hypotheses
Introduction
When you are visiting a city, you can usually find some important places by yourself, for example the central station, a supermarket, and maybe even a few touristic highlights. A better way, however, would be that a friend draws you a map with the places in the city you are interested in. Then you would also find the small French café, the little arthouse cinema, and the restaurant serving delicious oriental food. But this map will be limited by your friend’s knowledge of her district. What if you want to visit another part of the city? You will find yourself in the same position as before. Therefore, an even better way is to ask several people who live in different areas of the city. In this way, you can get a detailed picture of the whole city and, if you are lucky, even find the best brewed coffee in the city.
The same is true when you start in a new research field.
Authors of a scholarly paper cite publications and other sources they assume to be relevant for the topic of their paper. Thus, scholarly papers form a huge network, a view already propagated by one of the fathers of bibliometrics (
For this publication, we analysed co-citations of invasion hypotheses in research papers of the last two decades. Co-citation analysis was independently introduced by Irina
Invasion biology is a discipline that grew very slowly at first. In the 19th century, early concepts on non-native species were mentioned (
Our study aims were twofold. First, we wanted to find a suitable map of the field of invasion biology based on co-citation analysis. Second, we aimed to compare this map to those created with two other approaches: a map based on an assessment of the characteristics (“traits”) of hypotheses (
Methods
We defined 35 common concepts and hypotheses in invasion biology and their representing key publications (Table
A first hint about relationships between our key publications can be obtained from their direct citation links, but this approach is limited by the small sample size of publications. As there is some randomness in the act of citation, a larger sample size is useful. Using bibliographic coupling relations between key papers, i.e., analysing to which degree their reference lists overlap, has the same drawback.
An alternative approach, which we applied here, is co-citation analysis, where joint citations of key papers are analysed, using all publications of the field. This approach can thus draw from a much larger dataset.
We downloaded all 10,430 records citing any of our key publications from the Web of Science (WoS, as licensed for Freie Universität Berlin, March 2017). Variants of referencing key papers were identified semi-automatically with the help of an R-script provided by Felix Mattes. For example, missing or wrong author initials or wrong page numbers were corrected in this way. Then we determined the yearly citation and co-citation numbers of all key publications. We expect higher numbers of key papers cited in review papers which diminishes the weight of each co-citation. Therefore, we excluded reviews from the analysis.
Key invasion papers are also cited outside of invasion biology. We excluded such outside-of-the-field papers from co-citation analysis, as invasion hypotheses are primarily applied in invasion biology and we expect that peculiarities of their relationships are discussed within the field, whereas joint citations by publications outside of the field are less reliable for assessing such relationships. We defined papers belonging to the field as those that are returned by the term search proposed by
“Ecological invasion*” or “Biological invasion*” or “Invasion biology” or “Invasion ecology” or “Invasive species” or “Alien species” or “Introduced species” or “Non-native species” or “Nonnative species” or “Nonindigenous species” or “Non-indigenous species” or “Allochthonous species” or “Exotic species”.
Using this term search on 28.08.2017 in the WoS returned 30,731 records. After excluding 1,769 review papers, 28,962 papers remained in the sample. These are mainly primary research communications (28,295) and have mainly been published after 1990 (28,841; i.e. 99.6%). Figure

Numbers of publications in invasion biology, using the same search term as

Number of publications per year that cite at least two of the key papers given in Table
List of 35 common invasion hypotheses and how we defined them (cf.
| Hypothesis | Description | Key reference | |
|---|---|---|---|
| ADP | Adaptation | The invasion success of non-native species depends on the adaptation to the conditions in the exotic range before and/or after the introduction. Non-native species that are related to native species are more successful in this adaptation. |
|
| BA | Biotic acceptance aka “the rich get richer” | Ecosystems tend to accommodate the establishment and coexistence of non-native species despite the presence and abundance of native species. |
|
| BID | Biotic indirect effects | Non-native species benefit from different indirect effects triggered by native species. |
|
| BR | Biotic resistance aka diversity-invasibility hypothesis | An ecosystem with high biodiversity is more resistant against non-native species than an ecosystem with lower biodiversity. |
|
| DEM | Dynamic equilibrium model | The establishment of a non-native species depends on natural fluctuations of the ecosystem, which influences the competition of local species. |
|
| DN | Darwin’s naturalization | The invasion success of non-native species is higher in areas that are poor in closely related species than in areas that are rich in closely related species. |
|
| DS | Disturbance | The invasion success of non-native species is higher in highly disturbed than in relatively undisturbed ecosystems. |
|
| EE | Enemy of my enemy aka accumulation-of-local-pathogens hypothesis | Introduced enemies of a non-native species are less harmful to the non-native as compared to the native species. |
|
| EI | Enemy inversion | Introduced enemies of non-native species are less harmful for them in the exotic than the native range, due to altered biotic and abiotic conditions. |
|
| EICA | Evolution of increased competitive ability | After having been released from natural enemies, non-native species will allocate more energy in growth and/or reproduction (this re-allocation is due to genetic changes), which makes them more competitive. |
|
| EN | Empty niche | The invasion success of non-native species increases with the availability of empty niches in the exotic range. |
|
| ER | Enemy release | The absence of enemies in the exotic range is a cause of invasion success. |
|
| ERD | Enemy reduction | The partial release of enemies in the exotic range is a cause of invasion success. |
|
| EVH | Environmental heterogeneity | The invasion success of non-native species is high if the exotic range has a highly heterogeneous environment. |
|
| GC | Global competition | A large number of different non-native species is more successful than a small number. |
|
| HC | Human commensalism | Species that are living in close proximity to humans are more successful in invading new areas than other species. |
|
| HF | Habitat filtering | The invasion success of non-native species in the new area is high if they are pre-adapted to this area. |
|
| IM | Invasional meltdown | The presence of non-native species in an ecosystem facilitates invasion by additional species, increasing their likelihood of survival or ecological impact. | |
| IRA | Increased resource availability | The invasion success of non-native species increases with the availability of resources. |
|
| IS | Increased susceptibility | If a non-native species has a lower genetic diversity than the native species, there will be a low probability that the non-native species establishes itself. |
|
| ISH | Island susceptibility hypothesis | Non-native species are more likely to become established and have major ecological impacts on islands than on continents. |
|
| IW | Ideal weed | The invasion success of a non-native species depends on its specific traits (e.g. life-history traits). |
|
| LS | Limiting similarity | The invasion success of non-native species is high if they strongly differ from native species, and it is low if they are similar to native species. |
|
| MM | Missed mutualisms | In their exotic range, non-native species suffer from missing mutualists. |
|
| NAS | New associations | New relationships between non-native and native species can positively or negatively influence the establishment of the non-native species. |
|
| NW | Novel weapons | In the exotic range, non-native species can have a competitive advantage against native species because they possess a novel weapon, i.e. a trait that is new to the resident community of native species and therefore affects them negatively. |
|
| OW | Opportunity windows | The invasion success of non-native species increases with the availability of empty niches in the exotic range, and the availability of these niches fluctuates spatio-temporally. |
|
| PH | Plasticity hypothesis | Invasive species are more phenotypically plastic than non-invasive or native ones. |
|
| PP | Propagule pressure | A high propagule pressure (a composite measure consisting of the number of individuals introduced per introduction event and the frequency of introduction events) is a cause of invasion success. |
|
| RER | Resource-enemy release | The non-native species is released from its natural enemies and can spend more energy in its reproduction, and invasion success increases with the availability of resources. |
|
| RI | Reckless invader aka “boom-bust” | A non-native species that is highly successful shortly after its introduction can get reduced in its population or even extinct over time due to different reasons (such as competition with other introduced species or adaptation by native species). |
|
| SDH | Shifting defence hypothesis | After having been released from natural specialist enemies, non-native species will allocate more energy in cheap (energy-inexpensive) defenses against generalist enemies and less energy in expensive defenses against specialist enemies (this re-allocation is due to genetic changes); the energy gained in this way will be invested in growth and/or reproduction, which makes the non-native species more competitive. |
|
| SG | Specialist-generalist | Non-native species are more successful in a new region if the local predators are specialists and local mutualists are generalists. |
|
| SP | Sampling | A large number of different non-native species is more likely to become invasive than a small number due to interspecific competition. Also, the species identity of the locals is more important than the richness in terms of the invasion of an area. |
|
| TEN | Tens rule | Approximately 10% of species successfully take consecutive steps of the invasion process. |
|
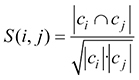
Salton’s cosine
In the n-dimensional vector space with one dimension per citing paper, each cited source i can be represented by a vector vik (k = 1, ..., n) with vik = 1 if paper k cites source i and vik = 0 otherwise. The Salton index S (i, j) of two sources is a similarity measure defined as the cosine of the angle between the two source vectors (
 , (1)
, (1)
where ci is the set of papers citing source publication i. Salton’s cosine gives values in the interval [0, 1]. Co-citations are usually determined within reference lists of citing publications ci published during a given year. Due to heavily fluctuating citation numbers, we combined several years to get broader citation windows. Due to this change, a challenge was that two key papers i and j published within the citation window in different years yi < yj have different chances to be cited: older papers have more opportunities to be cited than younger papers. We made their chances to be cited as equal as possible by reducing the set ci to citing papers published from year yj on.
Communities in networks
Clusters of highly cited sources containing often co-cited sources are assumed to represent knowledge bases of current research fronts (Small and Sweeny 1985). Such clusters are particularly useful for constructing conceptual maps that should serve as navigation tools for research fields, as they group similar concepts and hypotheses in one cluster. Especially in the last two decades, several clustering methods have been developed in network science (see
For the case of disjoint communities,
We compared the results of different algorithms for community detection from the packages SNA (
Beside global evaluation functions like modularity, there are also functions that evaluate cohesion and separation of each community. A community C is well separated from the rest of the network if the escape probability of a random walker is small (
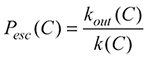 . (2)
. (2)
The weak definition of a community after
Results
We analysed different time periods (time steps of 1–5 years), but the results varied too much to get a clear picture. This means that the edges between the nodes varied from period to period. Obviously, in different years relationships between different concepts and hypotheses were discussed in the literature. We decided to accumulate the data from 1999 to 2017 to get a clearer, cumulative picture of relationships between invasion hypotheses.
We constructed two co-citation networks of our 31 key papers. Network M is based on

Partition of co-citation network M with maximum modularity q = 0.520. Links are weighted with significant co-citation numbers of hypothesis papers (significance level 95%, cf. text). For acronyms of hypotheses see Table
We compared the results obtained with different clustering algorithms (Table
The plasticity hypothesis (PH) switches between the enemy and the propagule cluster. In the M-network, PH has no links to the propagule cluster because the numbers of co-citations with papers of the cluster are not significant on the 95%-level.
The best partition of network M has modularity 0.520 (see Fig.

Partition of co-citation network S with maximum modularity q = 0.463. Links are weighted with Salton’s cosine of co-citation numbers of hypothesis papers above a minimum threshold of 0.1 (cf. text). For acronyms of hypotheses see Table
Partitions of co-citation networks M and S obtained by different algorithms maximizing modularity.
| Algorithm | Number of clusters | Modularity | ||
|---|---|---|---|---|
| M-network | S-network | M-network | S-network | |
| Cluster_optimal | 4 | 4 | 0.520 | 0.463 |
| Fast_greedy | 4 | 4 | 0.520 | 0.463 |
| Louvain | 4 | 4 | 0.520 | 0.463 |
| Leading_eigen | 6 | 4 | 0.502 | 0.441 |
| Edge_betweenness | 3 | 5 | 0.464 | 0.428 |
| Walktrap | 4 | 5 | 0.520 | 0.430 |
Partitions of co-citation networks M and S with maximum modularity. The key papers (see Table
| Network M | Network S | ||
|---|---|---|---|
| Hypothesis-paper | Internal strength | Hypothesis-paper | Internal strength |
| Darwin´s cluster | |||
| Pesc(C) = 0.27 | Pesc(C) = 0.24 | ||
| Adaptation (ADP 2002) | 54 | Darwin‘s naturalization (DN 2001) | 0.77 |
| Darwin‘s naturalization (DN 2001) | 53 | Adaptation (ADP 2002) | 0.76 |
| Limiting similarity (LS 1967) | 19 | Limiting similarity (LS 1967) | 0.57 |
| Habitat filtering (HF 1995) | 6 | Habitat filtering (HF 1995) | 0.32 |
| Niche cluster | |||
| Pesc(C) = 0.02 | Pesc(C) = 0.25 | ||
| Biotic resistance (BR 1999) | 243 | Biotic resistance (BR 1999) | 1.75 |
| Disturbance (DS 1992) | 163 | Disturbance (DS 1992) | 1.28 |
| Sampling (SP 1999) | 63 | Sampling (SP 1999) | 0.57 |
| Invasional meltdown (IM 1999) | 44 | Biotic acceptance (BA 2006) | 0.45 |
| Increased resource availability (IRA 1999) | 38 | Dynamic equilibrium model (DEM 1979) | 0.41 |
| Opportunity windows (OW 1986) | 37 | Empty niche (EN 1970) | 0.35 |
| Biotic acceptance (BA 2006) | 36 | Invasional meltdown (IM 1999) | 0.34 |
| Empty niche (EN 1970) | 33 | Opportunity windows (OW 1986) | 0.34 |
| Dynamic equilibrium model (DEM 1979) | 31 | Increased resource availability (IRA 1999) | 0.29 |
| Environmental heterogeneity (EVH 2007) | 24 | Environmental heterogeneity (EVH 2007) | 0.20 |
| Propagule cluster | |||
| Pesc(C) = 0.01 | Pesc(C) = 0.38 | ||
| Propagule pressure (PP 2005) | 186 | Propagule pressure (PP 2005) | 1.28 |
| Global competition (GC 2006) | 141 | Global competition (GC 2006) | 0.78 |
| Human commensalism (HC 2006) | 38 | Ideal weed (IW 1996) | 0.66 |
| Tens rule (TEN 1986) | 28 | Tens rule (TEN 1986) | 0.54 |
| Island susceptibility hypothesis (ISH 2008) | 11 | Island susceptibility hypothesis (ISH 2008) | 0.50 |
| Ideal weed (IW1996) | 10 | Human commensalism (HC 2006) | 0.46 |
| Plasticity hypothesis (PH 2006) | 0.40 | ||
| Enemy cluster | |||
| Pesc(C) = 0.02 | Pesc(C) = 0.14 | ||
| Enemy release (ER 2002) | 652 | Enemy release (ER 2002) | 2.41 |
| Evolution of increased competitive ability (EICA 1995) | 465 | Evolution of increased competitive ability (EICA 1995) | 1.98 |
| Enemy inversion, Enemy reduction, Increased susceptibility, New associations | 357 | Enemy inversion, Enemy reduction, Increased susceptibility, New associations (EI; ERD; IS; NAS 2004) | 1.58 |
| Missed mutualism | 196 | Missed mutualism (MM2006) | 1.37 |
| Novel weapons | 192 | Novel weapons (NW 2004) | 1.30 |
| Resource-enemy release (RER 2006) | 81 | Specialist-generalist, Biotic indirect effects (SG; BID 2004) | 1.04 |
| Specialist-generalist, Biotic indirect effects (SG; BID 2004) | 67 | Enemy of my enemy aka accumulation-of-local-pathogens hypothesis (EE 2006) | 0.69 |
| Enemy of my enemy aka accumulation-of-local-pathogens hypothesis (EE 2006) | 60 | Resource-enemy release (RER 2006) | 0.62 |
| Plasticity hypothesis (PH 2006) | 41 | Shifting defence hypothesis (SDH 2011) | 0.58 |
| Shifting defence hypothesis (SDH 2011) | 35 | Reckless invader aka “boom-bust” (RI 2004) | 0.24 |
| Reckless invader aka “boom-bust” (RI 2004) | 20 | ||
Discussion
The clusters of networks M and S are remarkably similar. Two of the four clusters in each network are even identical, namely the concept clusters focused on eco-evolutionary and phylogenetic relationships between non-native and resident species (Darwin’s cluster) and the concept cluster focused on biotic resistance of ecosystems against non-native species (resistance cluster). Comparing these two networks further, one can see that the other two concept clusters differ just in the membership of PH, the plasticity hypothesis. In one case (M-network), PH is in the concept cluster focused on species relationships (enemy cluster). In the other case (S-network), PH is a member of the concept cluster focused on introduction and species traits (propagule cluster).
What are the implications from the networks
The networks visualize how invasion biologists have seen their research field during the last two decades. Essentially, the networks suggest four broad themes that are represented by the four clusters. One core idea comes from evolutionary biology; it highlights the importance of eco-evolutionary relationships between non-native and resident species, and the capability of species to adapt to new environments (evolutionary perspective, Darwin’s cluster). A second core idea is the possibility that ecosystems can be resistant, or not, against non-native species based on their characteristics (ecosystem perspective, resistance cluster). A third core idea is that species interactions such as host-parasite or predator-prey interactions (including the loss of such interactions in the exotic environment, i.e., enemy release) are very important for understanding biological invasions (species-interactions perspective, enemy cluster). Finally, the most recent core idea is that human action is principally influencing biological invasions, which can thus only be understood by studies bridging different research fields (
Strongly connected hypothesis pairs
Some of the hypotheses in our networks are particularly strongly connected. In this section, we highlight one strongly connected hypothesis pair for each of the four clusters, and outline whether these connections are reasonable.
In Darwin’s cluster, the two hypotheses adaptation (ADP) and Darwin’s naturalization hypothesis (DN) are very strongly connected. The two key publications for these hypotheses included in Table
In the resistance cluster, there is a particularly strong connection between biotic resistance (BR) and the disturbance hypothesis (DS). These two hypotheses are in fact logically linked. According to DS, the invasion success of non-native species is higher in highly disturbed than in relatively undisturbed ecosystems (Table
In the propagule cluster, the propagule pressure hypothesis (PP) is very strongly connected to global competition (GC). The latter hypothesis is actually based on PP (
Finally in the enemy cluster, the enemy release hypothesis (ER) and EICA hypothesis are particularly strongly connected. This can also be easily explained, as EICA uses enemy release as an underlying assumption (Table
Which network is the better map
Although the clusters of the two networks are very similar, the better map is in our opinion the M-network. This is due to the following two reasons. First, the M-network has 25% less edges compared to the S-network which results in a clearer picture. Second, the clusters in the M-network are better separated from each other than in the S-network; all clusters in the M-network are communities in the strong sense, but this is only true for two clusters in the S-network.
Comparing the network to previous works
In comparison to the other two networks published by
The network in
Conclusions and outlook
The co-citation approach has proven useful to construct conceptual maps of the field of invasion biology. These maps, particularly the M-network, are clearer than previous maps created with other approaches. Efforts to create such conceptual maps that highlight relationships between major concepts within a research field are currently limited. In fact, we are unaware of other attempts to create such maps. This lack of conceptual maps means that researchers lack navigation tools which would help them identify where their work is located within a given research field such as invasion biology. The results of a recent online survey among >350 invasion biologists suggest that the participants lack a “joint vision how invasion hypotheses are related to each other” (
But the conceptual maps constructed for this study are early steps on the way towards advanced navigation tools. An important next step would be to allow for concepts and hypotheses to be included in more than one cluster, so that they can take the role of cluster-connecting concepts. To take this next step, a cluster-finding-algorithm that allows overlapping communities should be considered. Furthermore, we have thus far applied three different approaches to create conceptual maps. Other approaches can be imagined as well, for example based on a Delphi-approach in which a group of experts follows multiple iterative steps to create a consensus map. Further work should also involve the expansion of the network to include maps of related fields. In this way, a larger map, or atlas of science (see also
Data accessibility
The R script underlying this study is available via Dryad (https://doi.org/10.5061/dryad.d2q07t6).
Acknowledgements
We thank Felix Mattes for providing an R-script to identify variants of reference strings in the Web of Science. Financial support was provided by the Foundation of German Business (sdw) to ME and the Deutsche Forschungsgemeinschaft (DFG, JE 288/9-2) to JMJ.
References
- Amelio A, Pizzuti C (2014) An evolutionary approach for image segmentation. Evolutionary Computation 22: 525–557. https://doi.org/10.1162/EVCO_a_00115
- Blondel VD, Guillaume JL, Lambiotte R, Lefebvre E (2008) Fast unfolding of communities in large networks. Journal of Statistical Mechanics-Theory and Experiment 10: 10008. https://doi.org/10.1088/1742-5468/2008/10/P10008
- Blossey B, Nötzold R (1995) Evolution of increased competitive ability in invasive nonindigenous plants – a hypothesis. Journal of Ecology 83: 887–889. https://doi.org/10.2307/2261425
- Blumenthal DM (2006) Interactions between resource availability and enemy release in plant invasion. Ecology Letters 9: 887–895. https://doi.org/10.1111/j.1461-0248.2006.00934.x
- Börner K (2010) Atlas of Science: Visualizing What We Know. MIT Press, Cambridge/Massachusetts.
- Börner K (2015) Atlas of knowledge: anyone can map. MIT Press, Cambridge/Massachusetts.
- Boyack KW, Klavans R (2010) Co-citation analysis, bibliographic coupling, and direct citation: which citation approach represents the research front most accurately? Journal of the American Society for Information Science and Technology 61: 2389–2404. https://doi.org/10.1002/asi.21419
- Brandes U, Delling D, Gaertler M, Gorke R, Hoefer M, Nikoloski Z, Wagner D (2008) On modularity clustering. IEEE Transactions on Knowledge and Data Engineering 20: 172–188. https://doi.org/10.1109/TKDE.2007.190689
- Cadotte MW (2006) Darwin to Elton: early ecology and the problem of invasive species. In: Cadotte MW, Mcmahon SM, Fukami TE (Eds) Conceptual Ecology and Invasion Biology: Reciprocal Approaches to Nature. Springer (Dordrecht), 15–33. https://doi.org/10.1007/1-4020-4925-0_2
- Callaway RM, Ridenour WM (2004) Novel weapons: invasive success and the evolution of increased competitive ability. Frontiers in Ecology and the Environment 2: 436–443. https://doi.org/10.1890/1540-9295(2004)002[0436:NWISAT]2.0.CO;2
- Callaway RM, Thelen GC, Rodriguez A, Holben WE (2004) Soil biota and exotic plant invasion. Nature 427: 731–733. https://doi.org/10.1038/nature02322
- Catford JA, Jansson R, Nilsson C (2009) Reducing redundancy in invasion ecology by integrating hypotheses into a single theoretical framework. Diversity and Distributions 15: 22–40. https://doi.org/10.1111/j.1472-4642.2008.00521.x
- Clauset A, Newman MEJ, Moore C (2004) Finding community structure in very large networks. Physical Review E 70: 066111. https://doi.org/10.1103/PhysRevE.70.066111
- Colautti RI, Grigorovich IA, MacIsaac HJ (2006) Propagule pressure: a null model for biological invasions. Biological Invasions 8: 1023–1037. https://doi.org/10.1007/s10530-006-9007-7
- Colautti RI, Ricciardi A, Grigorovich IA, MacIsaac HJ (2004) Is invasion success explained by the enemy release hypothesis? Ecology Letters 7: 721–733. https://doi.org/10.1111/j.1461-0248.2004.00616.x
- Crawley MJ, Brown SL, Heard MS, Edwards GR (1999) Invasion-resistance in experimental grassland communities: species richness or species identity? Ecology Letters 2: 140–148. https://doi.org/10.1046/j.1461-0248.1999.00056.x
- Csardi G, Nepusz T (2006) The igraph software package for complex network research. InterJournal Complex Systems 1695. http://igraph.org
- Daehler CC (2001) Darwin’s naturalization hypothesis revisited. American Naturalist 158: 324–330. https://doi.org/10.1086/321316
- Darwin C (1859) On the Origin of Species by Means of Natural Selection. Murray (London).
- de Solla Price DJ (1965) Networks of scientific papers. Science 149: 510–515. https://doi.org/10.1126/science.149.3683.510
- Diez JM, Sullivan JJ, Hulme PE, Edwards G, Duncan RP (2008) Darwin’s naturalization conundrum: dissecting taxonomic patterns of species invasions. Ecology Letters 11: 674–681. https://doi.org/10.1111/j.1461-0248.2008.01178.x
- Doorduin LJ, Vrieling K (2011) A review of the phytochemical support for the shifting defence hypothesis. Phytochemistry Reviews 10: 99–106. https://doi.org/10.1007/s11101-010-9195-8
- Duncan RP, Williams PA (2002) Darwin’s naturalization hypothesis challenged. Nature 417: 608–609. https://doi.org/10.1038/417608a
- Egghe L, Leydesdorff L (2009) The relation between Pearson’s correlation coefficient r and Salton’s cosine measure. Journal of the American Society for Information Science and Technology 60: 1027–1036. https://doi.org/10.1002/asi.21009
- Elton CS (1958) The Ecology of Invasions by Animals and Plants. Methuen (London). https://doi.org/10.1007/978-1-4899-7214-9
- Enders M, Jeschke JM (2018) A network of invasion hypotheses. In: Jeschke JM, Heger T (Eds) Invasion Biology: Hypotheses and Evidence. CABI, Wallingford, 49–59. https://doi.org/10.1079/9781780647647.0049
- Enders M, Hütt M-T, Jeschke JM (2018) Drawing a map of invasion biology based on a network of hypotheses. Ecosphere 9: e02146. https://doi.org/10.1002/ecs2.2146
- Eppinga MB, Rietkerk M, Dekker S, De Ruiter PC, Van der Putten WH (2006) Accumulation of local pathogens: a new hypothesis to explain exotic plant invasions. Oikos 114: 168–176. https://doi.org/10.1111/j.2006.0030-1299.14625.x
- Fortunato S (2010) Community detection in graphs. Physics Reports-Review Section of Physics Letters 486: 75–174. https://doi.org/10.1016/j.physrep.2009.11.002
- Girvan M, Newman MEJ (2002) Community structure in social and biological networks. Proceedings of the National Academy of Sciences of the United States of America 99: 7821–7826. https://doi.org/10.1073/pnas.122653799
- Glänzel W, Thijs B (2017) Using hybrid methods and ‘core documents’ for the representation of clusters and topics: the astronomy dataset. Scientometrics 111: 1071–1087. https://doi.org/10.1007/s11192-017-2301-6
- Gläser J, Glänzel W, Scharnhorst A (2017) Same data – different results? Towards a comparative approach to the identification of thematic structures in science. Scientometrics 111: 981–998. https://doi.org/10.1007/s11192-017-2296-z
- Glenisson P, Glanzel W, Persson O (2005) Combining full-text analysis and bibliometric indicators: a pilot study. Scientometrics 63: 163–180. https://doi.org/10.1007/s11192-005-0208-0
- Gmür M (2003) Co-citation analysis and the search for invisible colleges: a methodological evaluation. Scientometrics 57: 27–57. https://doi.org/10.1023/A:1023619503005
- Hamers L, Hemeryck Y, Herweyers G, Janssen M, Kettrs H, Rousseau R, Vanhoutte A (1989) Similarity measures in scientometric research: the Jaccard index versus Salton’s cosine formula. Information Processing & Management 25: 315–318. https://doi.org/10.1016/0306-4573(89)90048-4
- Handcock MS, Hunter DR, Butts CT, Goodreau SM, Morris M (2003) Statnet: Software tools for the Statistical Modeling of Network Data. http://statnetproject.org
- Havemann F (2016) Einführung in die Bibliometrie. Gesellschaft für Wissenschaftsforschung, Berlin.
- Hobbs RJ, Huenneke LF (1992) Disturbance, diversity, and invasion – implications for conservation. Conservation Biology 6: 324–337. https://doi.org/10.1046/j.1523-1739.1992.06030324.x
- Huston M (1979) A general hypothesis of species diversity. American Naturalist 113: 81–101. https://doi.org/10.1086/283366
- Jeschke JM (2008) Across islands and continents, mammals are more successful invaders than birds. Diversity and Distributions 14: 913–916. https://doi.org/10.1111/j.1472-4642.2008.00488.x
- Jeschke JM (2014) General hypotheses in invasion ecology. Diversity and Distributions 20: 1229–1234. https://doi.org/10.1111/ddi.12258
- Jeschke JM, Strayer DL (2006) Determinants of vertebrate invasion success in Europe and North America. Global Change Biology 12: 1608–1619. https://doi.org/10.1111/j.1365-2486.2006.01213.x
- Jeschke JM, Heger T (2018) Invasion biology: hypotheses and evidence. CABI,Wallingford. https://doi.org/10.1079/9781780647647.0000
- Jeschke JM, Keesing F, Ostfeld RS (2013) Novel organisms: comparing invasive species, GMOs, and emerging pathogens. Ambio 42: 541–548. https://doi.org/10.1007/s13280-013-0387-5
- Jeschke JM, Enders M, Bagni M, Jeschke P, Zimmermann M, Heger T (2018) Hi-Knowledge.org. https://hi-knowledge.org [accessed 6 May 2019]
- Johnstone IM (1986) Plant invasion windows – a time-based classification of invasion potential. Biological Reviews 61: 369–394. https://doi.org/10.1111/j.1469-185X.1986.tb00659.x
- Jonas H (1979) Das Prinzip Verantwortung: Versuch einer Ethik für die technologische Zivilisation. Insel Verlag, Frankfurt am Main.
- Keane RM, Crawley MJ (2002) Exotic plant invasions and the enemy release hypothesis. Trends in Ecology & Evolution 17: 164–170. https://doi.org/10.1016/S0169-5347(02)02499-0
- Kitcher P (2011) Science in a democratic society. Prometheus (Amherst/NY).
- Kowarik I, Pysek P (2012) The first steps towards unifying concepts in invasion ecology were made one hundred years ago: revisiting the work of the Swiss botanist Albert Thellung. Diversity and Distributions 18: 1243–1252. https://doi.org/10.1111/ddi.12009
- Kueffer C (2017) Plant invasions in the Anthropocene. Science 358: 724–725. https://doi.org/10.1126/science.aao6371
- Levine JM, D’Antonio CM (1999) Elton revisited: a review of evidence linking diversity and invasibility. Oikos 87: 15–26. https://doi.org/10.2307/3546992
- Lockwood JL, Cassey P, Blackburn T (2005) The role of propagule pressure in explaining species invasions. Trends in Ecology & Evolution 20: 223–228. https://doi.org/10.1016/j.tree.2005.02.004
- Lowry E, Rollinson EJ, Laybourn AJ, Scott TE, Aiello-Lammens ME, Gray SM, Mickley J, Gurevitch J (2013) Biological invasions: a field synopsis, systematic review, and database of the literature. Ecology and Evolution 3: 1835–1835. https://doi.org/10.1002/ece3.431
- MacArthur R (1970) Species packing and competitive equilibrium for many species. Theoretical Population Biology 1: 1–11. https://doi.org/10.1016/0040-5809(70)90039-0
- MacArthur R, Levins R (1967) Limiting similarity convergence and divergence of coexisting species. American Naturalist 101: 377–385. https://doi.org/10.1086/282505
- Marbach-Ad G, Schaefer KL, Kumi BC, Friedman LA, Thompson KV and Doyle MP (2012) Development and evaluation of a prep course for chemistry graduate teaching assistants at a research university. Journal of Chemical Education 89: 865–872. https://doi.org/10.1021/ed200563b
- Marshakova IV (1973) System of document connections based on references. Nauchno-Tekhnicheskaya Informatsiya Seriya 2 – Informatsionnye Protsessy i Sistemy 6: 5.
- Meadows DH (1972) The Limits to Growth a Report for the Club of Rome’s Project on the Predicament of Mankind. Universe Books, New York. https://doi.org/10.1349/ddlp.1
- Melbourne BA, Cornell HV, Davies KF, Dugaw CJ, Elmendorf S, Freestone AL, Hall RJ, Harrison S, Hastings A, Holland M, Holyoak M, Lambrinos J, Moore K, Yokomizo H (2007) Invasion in a heterogeneous world: resistance, coexistence or hostile takeover? Ecology Letters 10: 77–94. https://doi.org/10.1111/j.1461-0248.2006.00987.x
- Mitchell CE, Agrawal AA, Bever JD, Gilbert GS, Hufbauer RA, Klironomos JN, Maron JL, Morris WF, Parker IM, Power AG, Seabloom EW, Torchin ME, Vazquez DP (2006) Biotic interactions and plant invasions. Ecology Letters 9: 726–740. https://doi.org/10.1111/j.1461-0248.2006.00908.x
- Newman MEJ (2006) Modularity and community structure in networks. Proceedings of the National Academy of Sciences of the United States of America 103: 8577–8582. https://doi.org/10.1073/pnas.0601602103
- Newman MEJ, Girvan M (2004) Finding and evaluating community structure in networks. Physical Review E 69: 026113. https://doi.org/10.1103/PhysRevE.69.026113
- Pons P, Latapy M (2005) Computing communities in large networks using random walks. Computer and Information Sciences – Iscis 2005 Proceedings 3733: 284–293. https://doi.org/10.1007/11569596_31
- Radicchi F, Castellano C, Cecconi F, Loreto V, Parisi D (2004) Defining and identifying communities in networks. Proceedings of the National Academy of Sciences of the United States of America 101: 2658–2663. https://doi.org/10.1073/pnas.0400054101
- Rejmánek M, Richardson DM (1996) What attributes make some plant species more invasive? Ecology 77: 1655–1661. https://doi.org/10.2307/2265768
- Richards CL, Bossdorf O, Muth NZ, Gurevitch J, Pigliucci M (2006) Jack of all trades, master of some? On the role of phenotypic plasticity in plant invasions. Ecology Letters 9: 981–993. https://doi.org/10.1111/j.1461-0248.2006.00950.x
- Richardson DM, Pyšek P (2008) Fifty years of invasion ecology – the legacy of Charles Elton. Diversity and Distributions 14: 161–168. https://doi.org/10.2307/2997649
- Richardson DM, Ricciardi A (2013) Misleading criticisms of invasion science: a field guide. Diversity and Distributions 19: 1461–1467. https://doi.org/10.1111/ddi.12150
- Sher AA, Hyatt LA (1999) The disturbed resource-flux invasion matrix: a new framework for patterns of plant invasion. Biological Invasions 1: 107–114. https://doi.org/10.1023/A:1010050420466
- Simberloff D, Holle BV (1999) Positive interactions of nonindigenous species: invasional meltdown? Biological Invasions 1: 21–32. https://doi.org/10.1023/A:1010086329619
- Simberloff D, Gibbons L (2004) Now you see them, now you don’t – population crashes of established introduced species. Biological Invasions 6: 161–172. https://doi.org/10.1023/B:BINV.0000022133.49752.46
- Small H (1973) Cocitation in the scientific literature: a new measure of the relationship between two documents. Journal of the American Society for Information Science 24: 265–269. https://doi.org/10.1002/asi.4630240406
- Small H, Sweeney E (1985) Clustering the science citation index using co-citations. 1. A comparison of methods. Scientometrics 7: 391–409. https://doi.org/10.1007/BF02017157
- Stohlgren TJ, Jarnevitch C, Chong GW (2006) Scale and plant invasions: a theory of biotic acceptance. Preslia 78: 405–426.
- Trujillo CM, Long TM (2018) Document co-citation analysis to enhance transdisciplinary research. Science Advances 4: e1701130. https://doi.org/10.1126/sciadv.1701130
- Vaz AS, Kueffer C, Kull CA, Richardson DM, Schindler S, Munoz-Pajares AJ, Vicente JR, Martins J, Hui C, Kuhn I, Honrado JP (2017) The progress of interdisciplinarity in invasion science. Ambio 46: 428–442. https://doi.org/10.1007/s13280-017-0897-7
- Velden T, Boyack KW, Gläser J, Koopman R, Scharnhorst A, Wang SH (2017) Comparison of topic extraction approaches and their results. Scientometrics 111: 1169–1221. https://doi.org/10.1007/s11192-017-2306-1
- Weiher E, Keddy PA (1995) Assembly rules, null models, and trait dispersion: new questions from old patterns. Oikos 74: 159–164. https://doi.org/10.2307/3545686
- Williamson MH, Brown KC (1986) The analysis and modeling of British invasions. Philosophical Transactions of the Royal Society of London Series B-Biological Sciences 314: 505–522. https://doi.org/10.1098/rstb.1986.0070
- Xie JR, Kelley S, Szymanski BK (2013) Overlapping community detection in networks: The state-of-the-art and comparative study. ACM Computing Surveys 45. https://doi.org/10.1145/2501654.2501657
- Yau CK, Porter A, Newman N, Suominen A (2014) Clustering scientific documents with topic modeling. Scientometrics 100: 767–786. https://doi.org/10.1007/s11192-014-1321-8