Research Article
Print
Research Article
Time to cut: population models reveal how to mow invasive common ragweed cost-effectively
expand article infoSuzanne T. E. Lommen, Eelke Jongejans§, Melinda Leitsch-Vitalos|, Barbara Tokarska-Guzik, Mihály Zalai#, Heinz Müller-Schärer, Gerhard Karrer|
‡ University of Fribourg, Fribourg, Switzerland
§ Radboud University, Nijmegen, Netherlands
| University of Natural Resources and Life Sciences, Vienna, Austria
¶ University of Silesia, Katowice, Poland
# Szent István University, Gödöllő, Hungary
Open Access

Abstract

Roadsides are an important habitat for invasive common ragweed, Ambrosia artemisiifolia L., by facilitating seed dispersal. Reducing the size of roadside populations is therefore essential for confining this highly allergenic species. Here, we aim to determine the cost-effectiveness of mowing regimes varying in frequency and timing, by analysing population-level effects and underlying demographic processes. We constructed population models of A. artemisiifolia parameterised by demographic data for four unmanaged reference populations across Europe in two years. We integrated the effects of four experimental mowing regimes along Austrian road sides on plant performance traits of five years and experimental data on seed viability after cutting. All four experimental regimes reduced the projected intrinsic population growth rates (r) compared to the unmanaged controls by reducing plant height and seed viability, thereby counteracting increased size-dependent fecundity. The prevailing 2-cut regime in Austria (cutting during vegetative growth, here in June and just before seed ripening, here in September) performed least well and the reduction in r was mainly due to reduced seed viability after the second cut. The efficacy of the two best experimental regimes (alternative schemes for 2 or 3 cuts) was mainly due to cutting just before female flowering (here in August) by decreasing final adult plant height dramatically and thereby reducing seed numbers. Patterns were consistent across reference populations and years. Whether regimes reduced r below replacement level, however, varied per population, year and the survival rate of the seeds in the soil bank. Our model allowed projecting effects of five theoretical mowing regimes with untested combinations of cuts on r. By plotting r-cost relationships for all regimes, we identified the most cost-effective schemes for each cutting frequency (1–3 cuts). They all included the cut just before female flowering, highlighting the importance of cutting at this moment (here in August). Our work features i) the suitability of a modelling approach for the demography of an annual species with a seed bank, ii) the importance of seed viability in assessing mowing effects, iii) the use of population models in designing cost-effective mowing regimes.

Keywords

Annual plant, population model, cost-effective management, population growth rate, seed viability, soil seed bank

Introduction

Successful management of invasive plant populations requires a cost-effective reduction of their population size, sufficient to mitigate their negative impact (Kerr et al. 2016; Simberloff 2003). Population models are used for predicting ecological benefits of management options (Crone et al. 2011). Realistic models require not only good demographic data covering the entire life cycle of the target species (i.e. all vital rates), but also knowledge of effects of management on each of these vital rates. The prediction of future effects and the implementation of management on a large geographic scale demands quantification of temporal and spatial variability of both vital rates and management effects (Crone et al. 2013; Salguero-Gómez and De Kroon 2010). Such extended data collection is, however, beyond the capacity or scope of most studies. Demographic data often cover not more than a few years for a limited number of populations on a small geographic scale (Crone et al. 2013), while management effects are typically estimated through experimentation at a single location (e.g. in a greenhouse or experimental field) and are often limited to assess individual-level effects. Moreover, often only a single aspect of disturbance is varied (intensity, frequency, timing, duration or extent), while the total effect of management likely results from interactions between these aspects, requiring a multi-aspect experimental approach as well (Zhang and Shea 2012). Besides, economic costs are only rarely incorporated into demographic studies (Kerr et al. 2016).

Common ragweed (Ambrosia artemisiifolia L.) is a worldwide invasive plant which has rapidly expanded in Europe in the past decades (Essl et al. 2015). Linear transport structures, such as roadsides, are amongst the most prevalent habitat types for the species in central and north western Europe (Essl et al. 2009; Karrer et al. 2011; Skálová et al. 2017; Tokarska-Guzik et al. 2011) and they are important pathways for introduction and dispersal (Chapman et al. 2016). For instance, seeds directly attach to machines used for road maintenance (Vitalos and Karrer 2009) and are indirectly moved by the airflow of passing vehicles (Karrer et al. 2011; von der Lippe et al. 2013). Management of populations of A. artemisiifolia along roadsides is hence a key priority for reducing population growth and limiting the number of seeds available for dispersal. Commonly, however, roadside vegetation management aims to reduce the vegetation height for safety on the road. The frequency of mowing is limited to keep costs low and the timing is adapted to the availability of the personnel. Therefore, the commonly applied regime is likely not suitable for reducing populations of A. artemisiifolia on roadsides (Milakovic et al. 2014b).

A multi-aspect experiment testing alternative mowing regimes along Austrian roadsides in multiple years showed that adapting the timing and/or frequency is required to reduce the seed production of individual A. artemisiifolia plants (Milakovic et al. 2014b). Although this is an annual species, data on seed production alone are insufficient to assess population-level effects because the species has a long-lasting seed bank (Bassett and Crompton 1975). Studying effects on population growth therefore also requires the inclusion of vital rates of seeds. A first assessment of the soil seed bank after 3 years supports the positive effect of some of these alternative mowing regimes in reducing the A. artemisiifolia population size compared to the untreated controls (Milakovic and Karrer 2016). The underlying demographic mechanisms, the effect of specific cuts and the projected population-level effects, however, have not yet been studied.

Here, we address these gaps in order to understand the efficacy of the tested mowing regimes in limiting growth of A. artemisiifolia populations, link these to management costs and design additional cost-effective mowing regimes. Specifically, we ask how mowing frequency and timing affect population growth of A. artemisiifolia? To answer this question, we analysed i) how mowing frequency and timing affect vital rates of plants in roadside populations and how these effects vary from year to year, ii) how mowing affects seed viability and iii) how much each of these mowing effects contribute to changes in population growth in different populations across Europe in different years. We construct population models for the study system and parameterise these with newly-collected demographic data from geographically distant populations across Europe and by integrating several existing and new data on the effect of mowing. Finally, we simulate new theoretical mowing regimes and compare their cost-effectiveness to the experimentally tested ones.

Methods

Study species

Ambrosia artemisiifolia originates from central USA and has invaded a wide range of habitat types on most other continents (Essl et al. 2015). It has severe adverse effects on agriculture (Bassett and Crompton 1975; Domonkos et al. 2017) and human health (Smith et al. 2013) due to its vast production of seeds and allergenic pollen, respectively. The monoecious annual typically develops pollen-producing flowers from mid-summer onwards, followed by female flowers in late summer, both aggregated in flowering heads. Each female flower can develop into a single seed, falling straight to the ground after maturation in autumn. Plants normally die before winter while shed seeds may accumulate in a long-lasting soil seed bank if not recruited in the next spring (Bassett and Crompton 1975; Toole and Brown 1946) (Fig. 1).

Figure 1.

Life cycle of the annual plant Ambrosia artemisiifolia. Months indicated are representative for populations in Europe where most new plants have established in June, have developed into seed-producing plants in September and then die while the seeds shed overwinter on or in the soil. The small loop represents (dormant) seeds that do not recruit but stay in the soil until the next year. The vital rates and corresponding parameters in the demographic model are listed for each period. The x represents new plant size in June, y the plant size in September, m the effect of mowing.

Data

Overview of data and approach

In order to parameterise all vital rates and integrate the effects of mowing (Fig. 1), we combined four different data sets: data from i) a roadside mowing experiment, ii) a post-harvest seed quality experiment, iii) a demographic survey and iv) seed burial experiments. The mowing experiment comprised a five-year application of four mowing regimes to roadsides in Austria, varying in the timing and frequency of cutting and an untreated control (main experimental results of the first three years can be found in Milakovic et al. 2014b). These data allowed quantifying the effect of the tested mowing regimes on individual plant height in September y, flowering fl, fecundity fec and seed ripening sr and how effect sizes of the reproductive rates depend on adult plant height y (one of the size variables in our population model) and vary from year to year (for stochastic population models). Since mowing can also affect seed quality (Bohren et al. 2008; Sölter et al. 2016), we obtained the effects of cutting on seed viability sv from a separate post-harvest seed quality experiment (Karrer 2016c). Neither of these experiments was designed for demographic modelling and, together, they provided insufficient data to parameterise all vital rates. We therefore chose to parameterise our models with demographic data from other populations of A. artemisiifolia, which were not mown. We chose four unmanaged populations elsewhere in Europe with similar vegetation and bioclimatic conditions. We conducted a demographic survey in two years providing data on all vital rates except seed ripening sr, seed viability sv and seed survival σ in the soil seed bank. The species has a long-lasting seed bank (Bassett and Crompton 1975) and such age-structured seed banks may play an important role in the population dynamics of an annual, for instance determining the time to extinction (Kalisz and McPeek 1992, 1993). We therefore complemented these demographic data with survival rates in the soil seed bank σ from long-term burial experiments (Karrer 2016a; Karrer et al. 2016) and used these to parameterise reference models representing untreated controls. We then integrated the experimental mowing effects m into these reference models to obtain models of mowing treatments. All analyses and models were performed using R (version 3.3.3, R Core Team 2017).

Roadside mowing experiment

A 5-year mowing experiment was set up along roadsides at six locations in 2009 and in a seventh location in 2010 in Austria. All locations were already infested with A. artemisiifolia for an unknown period and managed by a regular mowing regime for road maintenance, comprising a cut around June (during vegetative growth of A. artemisiifolia) and in September (just before seed ripening of A. artemisiifolia). In summary, each location was divided into five blocks of 20 m length each and, at each location, each of five treatments was randomly assigned to one block. Apart from the untreated control, experimental treatments were yearly applied by road service maintenance teams and included the prevailing mowing regime in eastern Austria and three alternative mowing regimes varying in the timing and frequency of cutting (upper half of Table 1). For ease, we named the mowing regimes according to the months in which cuts were performed (see corresponding phenological stages in Table 1). Details on the experimental design, data collection and results of the first three years are given in Milakovic et al. (2014b). For our demographic model we used data of all five years collected in September before the last cut, when adult plants were bearing seeds. Data were available from a random 20 individual ragweed plants per treatment per location per year or fewer, if fewer were present (see Suppl. material 1, fig. S1 for sample sizes and missing data). Measurements included maximum plant height, female flowering (female reproductive structures absent or present), the total number of individual seeds on the plant (irrespective of their developmental stage) and the most advanced developmental stage of these seeds per plant (classified as still flower, developing seed or ripe seed). We analysed interactive effects of mowing treatment, year and plant size where possible and applicable on all of these response variables by generalised mixed effect models. Plant size was included because mowing effects may vary with plant size, which can be incorporated into a population model. Best statistical models were revealed by comparing values of corrected Akaike information criterion and used to obtain estimates of coefficients of vital rates for their integration into the demographic models. Suppl. material 1 provides details on the statistical analyses, including an overview of the factors in the statistical models (Suppl. material 1, Table S1).

Table 1.

Overview of the experimental (upper half of table) and theoretical (lower half) mowing treatments. Their treatment code (indicating the calendar months in which cuts were conducted), the number and timing of cuts (each × indicating a cut) are shown.

Treatment code # cuts Timing of cuts Remarks Model equation used
Last week June (vegetative growth) Last week July (before peak male flowering) 3rd week Aug (before peak female flowering) 2nd week Sept (before seed ripening)
Experimental 0 0 Uncut control treatment (treatment 1 in mowing experiment) 1
69 2 × × Prevailing regime in eastern Austria (treatment 2 in mowing experiment) 2
89 2 × × Experimental new treatment (treatment 3 in mowing experiment) 2
679 3 × × × Experimental new treatment (treatment 4 in mowing experiment) 2
689 3 × × × Experimental new treatment (treatment 5 in mowing experiment) 2
Theoretical 6 1 × Modelled as treatment 69 without September cut 2
8 1 × Modelled as treatment 89 without September cut 2
67 2 × × Modelled as treatment 679 without September cut 2
68 2 × × Modelled as treatment 689 without September cut 2
9 1 × Modelled as control treatment 0 added with a September cut 2

Post-harvest seed quality experiment

The effects of cutting on seed viability were obtained from a post-harvest seed quality experiment (Karrer 2016c). Plants cultivated in a common garden in Vienna, Austria, bearing female reproductive structures were harvested by cutting them at different dates, corresponding to different developmental stages of the flowers and seeds. The harvested plants were left on the ground until the end of the growing season, when the developmental stage of the seeds was scored and their viability tested. We used the resulting percentage of ripe, viable seeds for each developmental stage harvested as seed viability. If plants were cut when female structures were still in the flowering stage (stages 1 and 2 in Karrer 2016b), these produce only 0.1% of viable seeds. Of plants cut while bearing unripe seeds, 27% of the seeds in early developmental stages (stage 3 in Karrer 2016b) and 43% of those in late developmental stages (stage 4 in Karrer 2016b) developed into ripe viable seeds. As the mowing experiment did not distinguish the age of unripe seeds, we used the average of these values (35%) for all unripe seeds. Of the seeds that were ripe when the plant was harvested (stage 5 in Karrer 2016b), 87% turned out to be viable.

Demographic survey

To serve as “reference” populations for the current mowing effect study, we selected A. artemisiifolia populations located in the same bioclimatic region as the Austrian sites of the mowing experiment (Continental or Pannonian), with the most similar habitat type possible (grasslands, since no unmanaged roadsides were available) and with plant heights covering the range of plant heights observed in the untreated controls of the mowing experiment. This yielded four populations located in Austria (AT), Hungary (HU), Italy (IT) and Poland (PL) (details in Suppl. material 2, Table S2). For the survey, we used specific standardised protocols developed for a coordinated European-wide demographic study of unmanaged populations of A. artemisiifolia across Europe started in 2014 (full demographic survey protocol available on https://www.protocols.io/, https://doi.org/10.17504/protocols.io.mmyc47w, see also Suppl. material 2). In summary, over a hundred individually labelled plants per population were monitored from June, when they were young vegetative plants, to seed set in September. This provided estimates of new plant size, survival, growth and flowering. Another set of 21 mature plants was harvested at seed set for estimates of fecundity (i.e. coinciding with the time in the year that plants in the mowing experiment were assessed before the cut in September). Numbers of new plants in quadrats and estimates of the associated soil seed bank size from soil samples provided estimates of recruitment rates. We monitored all four populations in 2014 and 2015, but no plants in the populations in Austria and Hungary survived until the end of the growing season of 2015 due to harsh competition by grasses. We therefore had six suitable reference data sets (AT14, HU14, IT14, IT15, PL14 and PL15) available for the analysis.

Seed burial experiments

To obtain values of seed survival rates, we used three of the largest available data sets for burial experiments with yearly measurements on our study species to date (Karrer 2016a; Karrer et al. 2016) (see overview in Suppl. material 3). Replicated bags with 50 seeds from plants from locations in Austria and Hungary had been buried at two different locations in Austria (details in Suppl. material 3, Table S3). Yearly sampling of subsets and subsequent viability tests provided three time series over 5 years, which we used to fit an exponentially declining model assuming age-independent mortality (Suppl. material 3, fig. S5). This provided three estimates of yearly seed survival rates in the soil seed bank (scenario “H” with seeds from Hagenbrunn, Austria: 0.792; scenario “K” with seeds from Kaposvar, Hungary: 0.963; scenario “U” with seeds from Unterpurkla, Austria: 0.921).

Population models

Population models of unmanaged references

Our discrete-time population model describes a time step of a year, from October (after seeds have been shed and plants have died) to October. As, in our model, individuals only exist as seeds in October, our model could be seen as unstructured. However, most vital rates in the model describe individual performance of plants from June to October and are functions of the continuous size variables x (plant height in June) or y (plant height in September). Our model is hence similar to a periodic Integral Projection Model with size as a continuous state variable (Ellner and Rees 2006) and consists of the three periods indicated in the large loop in Fig. 1. For the unmanaged reference populations, the number of seeds in seed bank SB in October after seed dispersal is described by equation 1:

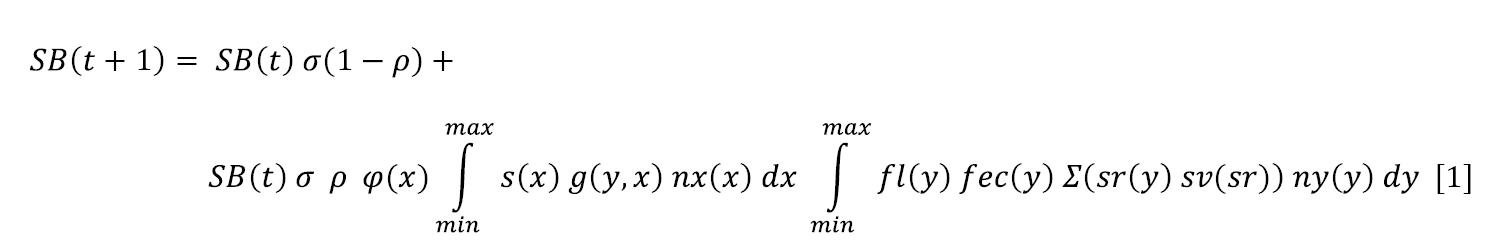
The first part of the equation describes the seeds that survived the entire year in the soil seed bank (small life cycle loop in Fig. 1) with survival σ, assuming that mortality occurs in winter (M. Leitsch-Vitalos, unpublished results). The second part describes the number of newly produced seeds in October at t+1 per seed at t and follows the large life cycle loop in Fig. 1 with integrals describing the transitions from June till September and from September till October, respectively. We use log-transformed plant height as a continuous variable describing individual size, because size classes are hard to distinguish in A. artemisiifolia and because this variable was the only common measure of size occurring in all data sets, while log-transformation yielded best fits of vital rate models. After seeds have survived the winter with probability σ, they recruit with probability ρ, resulting in nx new plants with distribution φ of size x in June. If they survive, ​s​(​​x​)​​​, they grow, g​(y, x)​, into ny plants of size y in September. If they flower, ​fl​(​​y​)​​​, they produce fec (y) new seeds. The total number of new viable seeds incorporated into the soil seed bank in October ​​(​​t + 1​)​​​ depends on the distribution sr​(y)​ of seeds over the ripening stages (flower, unripe seed, ripe seed) and the associated viability ​sv​(​​sr​)​​​ of each ripening stage. We did not include density-dependence in the model to conserve the ability to analyse intrinsic population growth rates analytically and because excluding density-dependence may be inappropriate when models are parameterised with realised levels of interspecific and intraspecific competition (Crone et al. 2013), which is the case in our demographic survey.

Using equation 1, we parameterised population models for all combinations of the six reference data sets and the three seed survival rates (i.e. a total of 18 reference scenarios, representing unmanaged controls). For details of the parameterisation, we refer to Suppl. material 4, which includes estimates of vital rates for each reference data set (Suppl. material 4, Table S4 and fig. S6–10). Integrations were applied to an extended range of plant sizes observed across all reference populations, from min (0.8 * the minimum height of new plants in June) to max (1.2 * the maximum plant height in September). We dealt with potential eviction (Williams et al. 2012) by adding all projected size values exceeding the size range to the corresponding most extreme size class.

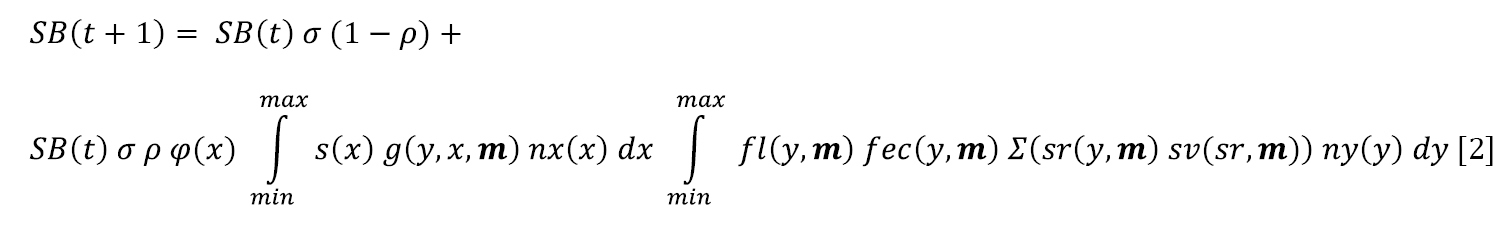
Population models of experimental mowing treatments

To project the effects of the experimental mowing treatments, equation 1 was extended by including dependence on mowing treatment m into all the relevant vital rate functions, resulting in equation 2 (modifications to equation 1 are indicated in bold):

Details of the parameterisation are elaborated in Suppl. material 5. Mowing effects on growth g, flowering fl, fecundity fec and seed ripening sr were derived from the mowing experiment, mowing effects on seed viability sv from the post-harvest seed quality experiment. Other parameters remained unchanged. We hence parameterised a set of 360 population models with equation 2, integrating the effects of each of the four experimental mowing treatments into each of the five mowing years into each of the 18 unmanaged reference scenarios. In order to understand the mechanisms by which treatments affect population growth, we quantified the relative contribution of each of the affected vital rates to changes in population growth (Δr). For that, we integrated mowing effects of single vital rates one by one in equation 2 for each of the 360 population models.

Simulating new theoretical mowing treatments with population models

Our approach allowed assessing the effect of new, experimentally untested combinations of cutting dates. Since the cut in September only affects population growth by modifying seed quality (through reduced seed ripening and corresponding lower seed viability) and no other vital rates, we were able to theoretically simulate removal or addition of this cut from the experimentally tested mowing regimes (Table 1, lower half). Thus, by removing the effect of the September cut from the four experimental mowing treatments 69, 89, 679 and 689, we simulated four new theoretical mowing treatments (6, 8, 67 and 68, respectively. To assess their effects for each reference model in each year, we created a second set of 360 population models equivalent to the 360 described above, maintaining mowing effects on growth, flowering and fecundity, but removing effects on seed ripening and viability. We also simulated a new theoretical mowing treatment 9 constituting mowing only in September by integrating the effect of mowing in September into the 18 reference scenarios (untreated controls, treatment 0), resulting in a second set of 18 alternative population models. Specifically, we integrated the effect of mowing in September on seed viability for each seed developing stage.

Analyses of population models

We obtained the projected intrinsic population growth rate, r, for each population model parameterised and compared them to assess the effect of treatments and the contribution of single vital rates. Since the effect of seed ripening only exerts an effect on r through the corresponding reduction in seed viability, we calculated the contribution of seed ripening alone as the difference between the growth rate when seed viability only was integrated and the growth rate when integrating both seed ripening and viability. To acknowledge temporal variation in experimental mowing effects (Metcalf et al. 2015), we also estimated a stochastic intrinsic population growth rate (rs) for each experimental mowing treatment in each reference scenario by iterating a population vector through a time series, sampling population model matrices of different mowing years with equal probability at every time step, using the R package IPMpack (version 2.1, Metcalf et al. 2013).

Results

Effects of mowing on vital rates of plants

For plant height in September, the full model with the interaction of treatment and year fitted the data best. The pattern of treatment effects was nevertheless fairly consistent across the years without a clear pattern over time (Fig. 2A and Suppl. material 1, fig. S2). Experimental treatments with a previous cut in August (89 and 689) reduced final plant height in September most, the treatment with a previous cut in July (679) moderately, while the treatment with a previous cut in June (69) increased or reduced height slightly, depending on the year and location (Suppl. material 1, fig. S1). All vital rates related to reproduction were strongly affected by treatment and plant height. In the best model of flowering, treatment and plant height had independent effects (Suppl. material 1, fig. S3). All mowing treatments and especially treatment 89 reduced flowering probability compared to the control, but the effect decreased with plant height and became negligible for plants taller than 40 cm (Fig. 2B). The best model of fecundity had no treatment × year interactions (Suppl. material 1, fig. S4), so the relative treatment effect was similar for all years (Fig. 2C). All mowing treatments increased size-dependent seed production, but the magnitude of this compensation changed with plant height, increasing for treatments 69 and 679 (i.e. the larger the plant, the stronger compensation of seed production), but decreasing for treatments 89 and 689, which include a cut in August (Fig. 2C).

Figure 2.

Fitted effects of experimental mowing treatments on vital rates. Experimental mowing treatments are indicated by their code (69, 89, 679, 689, see Table 1) and figures present fitted effects on A) mean plant height in September per year, B) flowering probability, C) fecundity and D) the development of seeds (see details of statistical models in main text and Suppl. material 1). Suppl. material 1 Effects in A–C are relative to that of the control treatment (0) and for B–D across all years as a function of the back-transformed covariable plant height in September. Dotted ends of lines in C and of the horizontal line at the bottom of D indicate where models were extrapolated beyond the range of observed plant height values.

Effects of mowing on seed quality

The best model for seed ripening contained the interaction between treatment and plant height. We found that mowing treatments generally delayed the development of seeds, especially for the transition from flowers to unripe seeds in smaller plants (Fig. 2D). Cutting in June resulted in relatively more ripe seeds if plants were not consecutively cut in July or August (Fig. 2D, treatment 69). Since the post-harvest experiment indicated that cutting reduces the viability of flowers and unripe seeds, this change in seed ripening has implications for the seed quality.

Effects of mowing on population growth

We projected stochastic intrinsic population growth, rs, for all 360 integrations of experimental mowing treatments and reference models. Although different seed survival scenarios resulted in very different values of r (Suppl. material 6, fig. S11), they did not alter patterns of experimental treatment effects. Therefore, we here report results based on seed survival scenario H, which had the lowest survival rates and best matched observed population dynamics in the reference data sets (S.T.E. Lommen, unpublished data). Projected rs varied a lot between reference data sets, but patterns of treatment effects were consistent (Fig. 3). Experimental treatments with cuts in August (89 and 689) always resulted in the lowest rs and, in most cases, rs was reduced until below replacement level (r = 0, where population size remains constant). The commonly applied treatment 69 performed worst by only decreasing rs somewhat, whereas treatment 679 had intermediate effects. The deterministic growth rates, r, based on mowing effects in single years (Suppl. material 7, fig. S12), are in line with the pattern of rs, except in reference IT14 where effects of mowing treatment 69 in 2012 project increased r compared to the control treatment.

Figure 3.

Effect of experimental mowing treatments on stochastic population growth rates rs for seed scenario H. Panels represent different populations (AT, HU, IT, PL) in year 2014 or 2015 (14 and 15, respectively) as detailed in Suppl. material 2, Table S2. The dashed line indicates the population replacement level.

Contribution of vital rates and seed quality to population growth

We assessed the contribution of all vital rates and seed quality to changes in projected deterministic intrinsic population growth r, which were independent of seed survival. All treatments reduced r mainly through the decrease in growth (i.e. lower plant height in September) and seed viability counteracting the increased size-dependent seed production (Fig. 4). The importance of each of these vital rates, however, differed between treatments (Fig. 4) and reference models (Suppl. material 7, fig. S13). In the most successful treatments 89 and 689, changes in growth contributed most to reduction in r (medians of -77% and -82%, respectively), while seed viability was the second most important (-34% and -31% respectively). The cut in September thus contributed to reducing r, but did not have the strongest effect. In treatment 679, reduction in seed viability and growth were equally important (-71% and -67%, respectively), but only achieved an overall intermediate effect due to strong increased size-dependent fecundity (+49%). In the least effective treatment 69, the reduction in r was largely due to reduced seed viability (-136%) opposing the effect of increased fecundity (+30%), while the effect of growth was negligible (-5%). In this treatment, the cut in September is crucial to obtain reduction in r. Mowing effects on flowering probability were of negligible importance in all mowing regimes.

Figure 4.

The influence of single vital rates and the September cut on population growth. Figures show the relative contributions of each vital rate (g = growth, fl = flowering, fec = fecundity, sr = seed ripening, sv = seed viability, see Fig. 1) and the cut in September (Sept, i.e. combined effect of sr and sv) to the total change in the population growth r per treatment. The y-axis represents the percentage change in r compared to the untreated reference, relative to the total change due to the mowing treatment (red dashed line at -100%). Boxplots indicate variation across reference data sets (N = 6) and years (N = 5, if applicable).

Cost-effectiveness of mowing regimes

We plotted r-cost relationships of all experimental and theoretical mowing treatments, assuming that each cutting intervention has the same costs. Therefore, the relative costs are represented by the number of cuts. Fig. 5 shows the r-cost relationships for the Austrian reference population in 2014 (AT14) and seed survival scenario H, but the main patterns are independent of the seed survival scenario (Suppl. material 8, fig. S14) and are similar in other reference data sets (Suppl. material 8, fig. S15). The figure reveals that the effectiveness of a given number of cuts is highly dependent on the timing of these cuts. With a budget for a single cut, cutting just before female flowering (here in August) is by far more cost-effective than cutting during vegetative growth (here in June) or before seed set (here in September). When a budget for two cuts is available, cutting just before female flowering and before seed set (here August and September) was most cost-effective and reduced ragweed growth rate more than the best 1-cut treatment. With a budget for three cuts, cutting during vegetative growth, just before female flowering and before seed set (here June, August and September) was the most cost-effective, but was hardly better in reducing ragweed growth rate than the best 2-cut regime. These three most cost-effective regimes thus all include a cut just before female flowering (here August). The graph also shows that some theoretical regimes are more effective than experimentally tested regimes with the same or a higher number of cuts (for instance, treatment 8 and 9 are more effective than 67 and 69 and treatment 68 is more effective than 679).

Figure 5.

Effect-cost relationships of mowing regimes for the Austrian reference population in 2014 (AT14) for seed survival scenario H. For each mowing regime (dots with labels indicating the months of cutting, see Table 1) and the untreated control (the dot at x = 0), the intrinsic growth rate r (as mean of the 5 years of experimental data) is plotted versus the relative costs of the regime (equalling the number of cuts). Mowing regimes theoretically simulated (by removing or adding the September cut to experimental treatments in the model, see Table 1) are indicated with an asterisk. Lines connect consecutive cuts, showing how extending mowing regimes with additional cuts at specific moments alters r.

Discussion

We show that optimising both the frequency and timing of cuts is the key to achieving the largest reductions in population growth rates (r) of A. artemisiifolia of roadsides by mowing. An increased frequency of cuts does not necessarily improve the effect, as was also found when mowing invasive thistles in the field (Bourdôt et al. 2016; Zhang and Shea 2012). Our r-cost chart (Fig. 5 and Suppl. material 8) allows the most cost-effective timing of cuts to be chosen for a given relative financial budget (i.e. allowing a certain number of cuts). It shows that the prevailing 2-cut mowing regime in Austria with cuts in June (during vegetative growth of A. artemisiifolia) and September (just before seed ripening of A. artemisiifolia) performs poorly while being relatively expensive. With a similar budget, the efficacy can be tripled by shifting the timing of the two cuts. Even cheaper options (i.e. mowing only once, either in August just before peak female flowering or in September) would be more effective in limiting r than the prevailing regime. The most effective regimes in reducing ragweed population growth rate were the experimentally tested 2-cut regime with a cut in August and September and the experimentally tested 3-cut regime with an additional cut in June. Our results are well in line with observed reductions in soil seed bank numbers after three years of the mowing experiment by Milakovic et al. (2016). They also found the common 2-cut regime with a cut in June and September to be least effective, while the two most effective regimes were the 2-cut regime with a cut in August and September, followed by the 3-cut regime with an additional cut in June.

We have provided a mechanistic understanding of how the experimental mowing regimes change projected population growth rates (Fig. 4). Mowing regimes had differential and size-dependent effects on the vital rates (Fig. 2). Importantly, the relative contribution of these effects to changes in projected intrinsic population growth (r) was also different for each regime (Fig. 4), as was earlier found for mowing an invasive thistle (Bourdôt et al. 2016). In the poor-performing prevailing 2-cut regime (with a cut in June and September), reduced seed viability is the largest determinant of the change in r, overruling effects of reduced plant size and compensation in seed ripening and fecundity (Fig. 4). In contrast, the best experimental mowing regimes (cutting in August and September or, additionally, in June) were effective because the extreme reduction in final plant size in September (Fig. 2A) contributed most to reduction in r (Fig. 4), while reduced seed viability contributed somewhat and the contribution of fecundity was negligible in these regimes. In the intermediately performing treatment (cutting in June, July and September), reduction in plant size and seed viability were equally important to counteract strongly compensating fecundity.

Our population modelling approach also unveiled the value of cuts at specific times through their effect on vital rates. Cutting during vegetative growth (here in June) has a small effect on final plant height (here in September) and the direction of the effect varied with year. Indeed, the species is known for its large regrowth capacity (Barbour and Meade 1981) and compensatory growth after cutting in early summer was also found in other cutting experiments with A. artemisiifolia (Basky et al. 2017; Bohren et al. 2008; Milakovic et al. 2014a). A single-cut regime at this time might, therefore, even lead to an increased r in some years. Comparing similar regimes with and without cutting during vegetative growth reveals that cutting at this stage has little added value to changing r when later cuts are conducted (Fig. 5, experimental treatments 89 and 689). If not followed by a cut just before female flowering (here in August), cutting just before male flowering (here in July) reduces plant size moderately but exerts a large compensation in seed production by larger plants (up to 1.7-fold, treatment 679 in Fig. 2C) and is therefore not very effective. Cutting just before female flowering (here in August) obviously leads to the strongest reductions in plant size in September as plants have very little time left to regrow before seed set (here in September). In addition, this cut triggered overcompensating seed production only in the smallest plants which bear the fewest seeds. As the total effect on r for regimes including this cut is mainly determined by a reduction in plant height, cutting at this moment is very effective in reducing r. Indeed, our r-cost figure shows that, for each given budget (i.e. allowing a certain number of cuts), the most cost-effective regime includes a cut just before female flowering (in our case in August). The value of the cut just before seed ripening (here in September), which reduces seed viability, depends strongly on the cutting history. This can be seen by following the connected lines in the r-cost chart (Fig. 5). After a single cut during vegetative growth (here in June, hence indicated by “6”), an additional cut before seed ripening largely reduces the projected population growth (indicated by “69”). In contrast, after a cut just before female flowering (here in August, e.g. “8” or “68”), an additional cut before seed ripening adds relatively little.

The results have wider implications for designing management strategies by using population models. A common approach is the identification of key life-cycle stages having the greatest impact on population growth rates (Caswell 1978) as a target for management strategies (Buckley et al. 2003; Karrer 2016b; Ramula et al. 2008; Shea and Kelly 1998). Our results, however, suggest taking care when relying on interventions affecting these vital rates, as their importance for population growth can vary with the timing of the interventions. This has also been observed when cutting at different moments for the control of invasive milkweed (Zalai et al. 2017). In addition, the large contribution of seed viability to changes in r in some regimes highlights the importance of including seed quality in population models in addition to seed quantity.

Our population models are not meant to predict absolute values of intrinsic population growth. Firstly, we have shown that the reported r values highly depend on the persistence in the soil seed bank. Our best estimates for seed survival came from burial experiments, while in roadside populations, seeds are unlikely to be buried deeply. When they remain on the surface of the ground, they are exposed to different abiotic conditions and other factors that may cause additional mortality, such as seed predation. Our scenarios for seed survival are therefore conservative. Although the pattern of the r-cost curves is independent of seed survival, mowing will bring r to lower values when seed survival is lower. It is known in other systems, especially annuals with a seed bank, that demographic models can be strongly influenced by seed survival rates (Gross and Mackay 2014), but long-term data on spatial variation in soil seed banks are scarce for many invasive species (Gioria et al. 2012). Secondly, we do not, unfortunately, have field data on how mowing affects recruitment, sizes of new plants and plant survival of our species and hence, we did not include such effects in our models. Plant survival is unlikely to be directly affected much by mowing as our species has large capacity for re-growth, forming new lateral shoots when the main stem is cut (Bohren et al. 2008; Kazinczi et al. 2008; Milakovic et al. 2014a). Such resprouting was even observed in 75–100% of plants cut two or three times (Milakovic et al. 2014a; Patracchini et al. 2011). If mowing removes or weakens competitors, recruitment, survival and the size of new A. artemisiifolia plants may be promoted (Bazzaz 1979). In contrast, litter deposition resulting from mowing could potentially limit these vital rates, as has been shown for a biennial grassland forb (Lennartsson and Oostermeijer 2001). Thirdly, we have projected (stochastic) exponential population growth assuming no change in environmental variables. We acknowledge that this assumption is unrealistic in our study system. The species thrives by disturbance (Bassett and Crompton 1975), which is inherent in roadsides. The environment is also likely changing by processes such as succession, change in land use and, in the long term, climate change, all altering vegetation composition and hence plant competition (Essl et al. 2015). Altogether, our models should be used for comparing relative efficacy of mowing regimes, but not for predicting absolute sizes or extinction rates (Crone et al. 2013) of ragweed populations along roadsides.

Our r-cost chart shows the relative costs, corresponding to the number of yearly cuts which a mowing regime comprises. The absolute costs for mowing along roadsides per cut per kilometre are unavailable. They depend on very specific circumstances of the responsible authorities. For instance, the number of workers and machinery needed at distinct dates for spatiotemporally fitted optimal mowing varies between countries and regions (personal observation, G. Karrer). In many cases, additional personnel and machinery have to be rented, adding costs to the fixed expenses for regular personnel and machinery.

We are aware that we used our models mainly to assess mowing effects on population size, while other results of local demography and treatments may be of interest to managers as well, such as the total seed output (discussed above), pollen production or population spread. Optimal management for reducing the number of plants does not necessarily need to coincide with optimal management of other target variables (Shea et al. 2010). Considerations, other than reducing population size, may require different or additional timing of cutting. For example, road safety may demand cutting early in the growing season, while roadside management may also be targeted at reducing ragweed pollen numbers. Experimental studies indicated that cutting twice was more effective in reducing pollen production than cutting once (Basky et al. 2017; Simard and Benoit 2011). Our r-cost chart can be helpful in determining which mowing regime to choose to reduce population sizes best, given such constraints. Further optimisation of mowing strategies may be achieved by adjusting other aspects of the disturbance framework of Zhang and Shea (2012), such as adapting the total duration of the management of an invasive grass (Hansen 2007). Adapting the intensity of the mowing intervention (i.e. altering cutting height) is, however, technically limited by the machinery used and the micro-scale morphology of the terrain surface along roadsides (Patracchini et al. 2011).

Our study focused on cost-effective local management of roadsides and evaluated management impact by population size of the target. For a comprehensive economic assessment of the efficacy of management of A. artemisiifolia at the regional level, however, efficacy beyond the population level should be assessed. As Ambrosia artemisiifolia occurs in different climatic areas (Sun et al. 2017) and in a wide range of habitat types (Essl et al. 2015), a recent European-wide study showed that differences in performance of populations are related to such environmental variations (Lommen et al. 2017). This variation in performance and population-level effects of management (as shown in this paper) should therefore be linked to effects on spatial distribution and spread (Normand et al. 2014; Shea et al. 2010), the latter taking into account the landscape structure (Caplat et al. 2012) and habitat suitability (Richter et al. 2013b). As the habitat types (e.g. grassland, crop land, riversides) often have various stakeholders and managers and require different management measures (Buttenschøn et al. 2009), interactions between managers and their management efforts also need to be considered (Caplat et al. 2012). Regional management efforts could then be optimised cost-effectively by spatial prioritisation of local management methods in prioritised habitat types (Richter et al. 2013a; Richter et al. 2013b). Population models can thus contribute to refining regional management efforts. A protocol, recently launched, describes a method for systematically reviewing the effectiveness of different management options on A. artemisiifolia, including effects of confounding factors such as habitat, climate, frequency and timing of the treatments (Schindler et al. 2016).

Conclusions

Overall, our population modelling approach has proven to be a useful tool for comparing population-level effects of different mowing regimes for an annual plant with a long-lasting seed bank. Integration of mowing effects into reference models of four geographically distant populations in Europe in two different years showed that patterns of projected population effects were consistent across time and space (Suppl. material 4, figs S6–10), despite the variation in dynamics amongst the reference locations and years (Suppl. material 4, Table S4). The results of our study can thus inform management in a wide geographic area and are robust to temporal variation in population dynamics. This is likely partly due to the annual life cycle of this species and the drastic effects of mowing. By disentangling effects of cutting at specific moments, our method also proved capable in designing new mowing regimes (i.e. new combinations of cuts at specific moments) that were experimentally untested. Even more regimes could be theoretically tested in this way if future management experiments were designed to single out effects of cuts at specific moments and if the measurements were adapted to provide input for demographic models (Bourdôt et al. 2016). We have shown that the effect of a mowing regime on A. artemisiifolia population size is not simply a function of the total number of cuts, but highly depends on the timing of the subsequent cuts it comprises. Fewer well-timed cuts can therefore be more effective in reducing population sizes of A. artemisiifolia along roadsides than regimes with a higher number of cuts. Our work highlights the importance of a cut before female flowering (in our case in August), as this was part of all most cost-effective management options found in our study.

Acknowledgements

We are thankful to all land owners for allowing us to undertake the demographic studies and to Maira Bonini and her team for arranging the Italian site. We greatly appreciate all the help in demographic data collection by Eva van Cleef, Simon Vandenbrande, Elisa Cardarelli, Silvia Stefanelli, Stéphanie von Bergen, Gaelle Kadima, Sanela Milenkovic, Aleksandra Krsmanovic, Nina Waldhäuser and Ivana Milakovic. We also thank an anonymous reviewer for constructive comments on cost-effectiveness. This research was funded by the Swiss State Secretariat for Education, Research and Innovation (C13.0146; to HMS), the Swiss Federal Office for the Environment (13.0098.KP/M323-0760; to HMS), the Netherlands Organisation for Scientific Research (NWO-grants 840.11.001/841.11.007; to EJ), the Austrian Ministry of Agriculture, Forestry, Environment and Water and eight Federal State Governments of Austria, the EFOP-3.6.3-VEKOP-16-2017-00008 project co-financed by the European Union and the European Social Fund, the Department of Botany and Nature Protection of the Faculty of Biology and Environmental Protection of the University of Silesia in Katowice (to BTG), DG Environment of the European Commission (project ‘HALT Ambrosia’, Grant Agreement No. 07.0322/2010/586340/SUB/B2) and the EU COST Action FA1203 ‘Sustainable management of Ambrosia artemisiifolia in Europe (SMARTER)’ (Müller-Schärer and Lommen 2014).

References

  • Barbour BM, Meade JA (1981) The effects of cutting date and height on anthesis of common ragweed (Ambrosia artemisiifolia L.). Proceedings of the Annual Meeting Northeast Weed Science Society 35: 82–86.
  • Basky Z, Ladányi M, Simončič A (2017) Efficient reduction of biomass, seed and season long pollen production of common ragweed (Ambrosia artemisiifolia L.). Urban Forestry & Urban Greening 24: 134–140. https://doi.org/10.1016/j.ufug.2017.03.028
  • Bassett IJ, Crompton CW (1975) The biology of Canadian weeds: Ambrosia artemisiifolia L. and A. psilostachya DC. Canadian Journal of Plant Science 55: 463–476. https://doi.org/10.4141/cjps75-072
  • Bohren C, Delabays N, Mermillod G, Baker A, Vertenten J (2008) Ambrosia artemisiifolia L: Optimieren des Schnittregimes. Agrarforschung 15: 308–313.
  • Bourdôt GW, Basse B, Cripps MG (2016) Mowing strategies for controlling Cirsium arvense in a permanent pasture in New Zealand compared using a matrix model. Ecology and Evolution 6: 2968–2977. https://doi.org/10.1002/ece3.2090
  • Buckley YM, Briese DT, Rees M (2003) Demography and management of the invasive plant species Hypericum perforatum. I. Using multi-level mixed-effects models for characterizing growth, survival and fecundity in a long-term data set. Journal of Applied Ecology 40: 481–493. https://doi.org/10.1046/j.1365-2664.2003.00821.x
  • Buttenschøn RM, Waldispühl S, Bohren C (2009) Guidelines for management of common ragweed, Ambrosia artemisiifolia. University of Copenhagen, 53 pp.
  • Caplat P, Coutts S, Buckley YM (2012) Modeling population dynamics, landscape structure, and management decisions for controlling the spread of invasive plants. In: Ostfeld RS, Schlesinger WH (Eds) Year in Ecology and Conservation Biology.Blackwell Science Publ, Oxford, 72–83. https://doi.org/10.1111/j.1749-6632.2011.06313.x
  • Chapman DS, Makra L, Albertini R, Bonini M, Paldy A, Rodinkova V, Sikoparija B, Weryszko-Chmielewska E, Bullock JM (2016) Modelling the introduction and spread of non-native species: international trade and climate change drive ragweed invasion. Global Change Biology 22: 3067–3079. https://doi.org/10.1111/gcb.13220
  • Crone EE, Ellis MM, Morris WF, Stanley A, Bell T, Bierzychudek P, EhrlÉN J, Kaye TN, Knight TM, Lesica P, Oostermeijer G, Quintana-Ascencio PF, Ticktin T, Valverde T, Williams JL, Doak DF, Ganesan R, McEachern K, Thorpe AS, Menges ES (2013) Ability of Matrix Models to Explain the Past and Predict the Future of Plant Populations. Conservation Biology 27: 968–978. https://doi.org/10.1111/cobi.12049
  • Crone EE, Menges ES, Ellis MM, Bell T, Bierzychudek P, Ehrlén J, Kaye TN, Knight TM, Lesica P, Morris WF, Oostermeijer G, Quintana-Ascencio PF, Stanley A, Ticktin T, Valverde T, Williams JL (2011) How do plant ecologists use matrix population models? Ecology Letters 14: 1–8. https://doi.org/10.1111/j.1461-0248.2010.01540.x
  • Domonkos Z, Szigeti Szabó V, Farkas A, Pinke G, Reisinger P, Vereš T, Tóth P (2017) Spread of common ragweed (Ambrosia artemisiifolia L.) on arable land in the Žitný ostrov. Journal of Central European Agriculture 18: 29–41. https://doi.org/10.5513/JCEA01/18.1.1863
  • Ellner SP, Rees M (2006) Integral projection models for species with complex demography. American Naturalist 167: 410–428. https://doi.org/10.1086/499438
  • Essl F, Biró K, Brandes D, Broennimann O, Bullock JM, Chapman DS, Chauvel B, Dullinger S, Fumanal B, Guisan A, Karrer G, Kazinczi G, Kueffer C, Laitung B, Lavoie C, Leitner M, Mang T, Moser D, Müller-Schärer H, Petitpierre B, Richter R, Schaffner U, Smith M, Starfinger U, Vautard R, Vogl G, von der Lippe M, Follak S (2015) Biological Flora of the British Isles: Ambrosia artemisiifolia. Journal of Ecology 103: 1069–1098. https://doi.org/10.1111/1365-2745.12424
  • Essl F, Dullinger S, Kleinbauer I (2009) Changes in the spatio-temporal patterns and habitat preferences of Ambrosia artemisiifolia during its invasion of Austria. Preslia 81: 119–133.
  • Gioria M, Pyšek P, Moravcova L (2012) Soil seed banks in plant invasions: promoting species invasiveness and long-term impact on plant community dynamics. Preslia 84: 327–350.
  • Gross CL, Mackay D (2014) Two decades of demography reveals that seed and seedling transitions limit population persistence in a translocated shrub. Annals of Botany 114: 85–96. https://doi.org/10.1093/aob/mcu082
  • Hansen MJ (2007) Evaluating management strategies and recovery of an invasive grass (Agropyron cristatum) using matrix population models. Biological Conservation 140: 91–99. https://doi.org/10.1016/j.biocon.2007.07.028
  • Kalisz S, McPeek MA (1992) Demography of an age-structured annual: resampled projection matrices, elasticity analyses, and seed bank effects. Ecology 73: 1082–1093. https://doi.org/10.2307/1940182
  • Karrer G (2016a) Field experiment on longevity of the seeds in the soil seed bank (initial seed burial experiment at the University of Natural Resources and Life Sciences BOKU). In: Sölter U, Starfinger U, Verschwele A (Eds) HALT Ambrosia – final project report and general publication of project findings (Julius-Kühn-Archiv 455).Quedlinburg, 48–49. https://doi.org/10.5073/jka.2016.455.18
  • Karrer G (2016b) Implications of life history for control and eradication. In: Söltner U, Starfinger U, Verschwele A (Eds) HALT Ambrosia – final project report and general publication of project findings (Julius-Kühn-Archiv 455).Quedlinburg, 58–64. https://doi.org/10.5073/jka.2016.455.18
  • Karrer G (2016c) Post harvest seed ripening (pot experiment). In: Sölter U, Starfinger U, Verschwele A (Eds) HALT Ambrosia – final project report and general publication of project findings (Julius-Kühn-Archiv 455).Quedlinburg, 37–40. https://doi.org/10.5073/jka.2016.455.18
  • Karrer G, Hall R, Lener F, Waldhäuser N, Kazinczi G, Kerepesi I, Máté S, Sölter U, Starfinger U, Verschwele A, Mathiassen SK, Kudsk P, Leskovšek R, Simončič A (2016) Field experiment on longevity of the seeds in the soil seed bank (Joint experiment). In: Sölter U, Starfinger U, Verschwele A (Eds) HALT Ambrosia – final project report and general publication of project findings (Julius-Kühn-Archiv 455).Quedlinburg, 41–47. https://doi.org/10.5073/jka.2016.455.18
  • Karrer G, Milakovic M, Kropf M, Hackl G, Essl F, Hauser M, Mayer M, Blöch C, Leitsch-Vitalos M, Dlugosch A, Hackl G, Follak S, Fertsak S, Schwab M, Baumgarten A, Gansberger M, Moosbeckhofer R, Reiter E, Publig E, Moser D, Kleinbauer I, Dullinger S (2011) Dispersal and management of a highly allergenic introduced plant – pathways and causes for the dispersal of ragweed (Ambrosia artemisiifolia) and options for control. Vienna, 329 pp.
  • Kazinczi G, Novák R, Pathy Z, Béres I (2008) Common ragweed (Ambrosia artemisiifolia L.): a review with special regards to the results in Hungary. III. Resistant biotypes, control methods and authority arrangements. Herbologia: an international journal on weed research and control 9: 119–144.
  • Kerr NZ, Baxter PWJ, Salguero-Gómez R, Wardle GM, Buckley YM (2016) Prioritizing management actions for invasive populations using cost, efficacy, demography and expert opinion for 14 plant species world-wide. Journal of Applied Ecology 53: 305–316. https://doi.org/10.1111/1365-2664.12592
  • Lennartsson T, Oostermeijer JGB (2001) Demographic variation and population viability in Gentianella campestris: effects of grassland management and environmental stochasticity. Journal of Ecology 89: 451–463. https://doi.org/10.1046/j.1365-2745.2001.00566.x
  • Lommen STE, Hallmann CA, Jongejans E, Chauvel B, Leitsch-Vitalos M, Aleksanyan A, Tóth P, Preda C, Šćepanović M, Onen H, Tokarska-Guzik B, Anastasiu P, Dorner Z, Fenesi A, Karrer G, Nagy K, Pinke G, Tiborcz V, Zagyvai G, Zalai M, Kazinczi G, Leskovšek R, Stešević D, Fried G, Kalatozishvili L, Lemke A, Müller-Schärer H (2017) Explaining variability in the production of seed and allergenic pollen by invasive Ambrosia artemisiifolia across Europe. Biological Invasions. https://doi.org/10.1007/s10530-017-1640-9
  • Metcalf CJE, Ellner SP, Childs DZ, Salguero-Gomez R, Merow C, McMahon SM, Jongejans E, Rees M (2015) Statistical modelling of annual variation for inference on stochastic population dynamics using Integral Projection Models. Methods in Ecology and Evolution 6: 1007–1017. https://doi.org/10.1111/2041-210x.12405
  • Metcalf CJE, McMahon SM, Salguero-Gomez R, Jongejans E (2013) IPMpack: an R package for integral projection models. Methods in Ecology and Evolution 4: 195–200. https://doi.org/10.1111/2041-210x.12001
  • Milakovic I, Fiedler K, Karrer G (2014a) Fine-tuning of a mowing regime, a method for the management of the invasive plant, Ambrosia artemisiifolia, at different population densities. Weed Biology and Management 14: 232–241. https://doi.org/10.1111/wbm.12051
  • Milakovic I, Fiedler K, Karrer G (2014b) Management of roadside populations of invasive Ambrosia artemisiifolia by mowing. Weed Research 54: 256–264. https://doi.org/10.1111/wre.12074
  • Müller-Schärer H, Lommen S (2014) EU-COST Action on „Sustainable management of Ambrosia artemisiifolia in Europe“ (COST FA1203-SMARTER): opportunities and challenges. Julius-Kühn-Archiv 445 148–155. https://doi.org/10.5073/jka.2013.445.018
  • Normand S, Zimmermann NE, Schurr FM, Lischke H (2014) Demography as the basis for understanding and predicting range dynamics. Ecography 37: 1149–1154. doi:https://doi.org/10.1111/ecog.01490
  • Patracchini C, Vidotto F, Ferrero A (2011) Common ragweed (Ambrosia artemisiifolia) growth as affected by plant density and clipping. Weed Technology 25: 268–276. https://doi.org/10.1614/wt-d-09-00070.1
  • R Core Team (2017) R: A language and environment for statistical computing http://www.R-project.org/ [accessed 10 March.2017]
  • Ramula S, Knight TM, Burns JH, Buckley YM (2008) General guidelines for invasive plant management based on comparative demography of invasive and native plant populations. Journal of Applied Ecology 45: 1124–1133. https://doi.org/10.1111/j.1365-2664.2008.01502.x
  • Richter R, Berger UE, Dullinger S, Essl F, Leitner M, Smith M, Vogl G, Firn J (2013a) Spread of invasive ragweed: climate change, management and how to reduce allergy costs. Journal of Applied Ecology 50: 1422–1430. doi:https://doi.org/10.1111/1365-2664.12156
  • Richter R, Dullinger S, Essl F, Leitner M, Vogl G (2013b) How to account for habitat suitability in weed management programmes? Biological Invasions 15: 657–669. https://doi.org/10.1007/s10530-012-0316-8
  • Schindler S, Bayliss HR, Essl F, Rabitsch W, Follak S, Pullin AS (2016) Effectiveness of management interventions for control of invasive common ragweed Ambrosia artemisiifolia: a systematic review protocol. Environmental Evidence 5: 11. https://doi.org/10.1186/s13750-016-0062-y
  • Shea K, Jongejans E, Skarpaas O, Kelly D, Sheppard AW (2010) Optimal management strategies to control local population growth or population spread may not be the same. Ecological Applications 20: 1148–1161. https://doi.org/10.1890/09-0316.1
  • Shea K, Kelly D (1998) Estimating biocontrol agent impact with matrix models: Carduus nutans in New Zealand. Ecological Applications 8: 824–832. https://doi.org/10.2307/2641269
  • Simard M-J, Benoit DL (2011) Effect of repetitive mowing on common ragweed (Ambrosia artemisiifolia L.) pollen and seed production. Annals of Agricultural and Environmental Medicine 18: 55–62.
  • Skálová H, Guo W-Y, Wild J, Pyšek P (2017) Ambrosia artemisiifolia in the Czech Republic: history of invasion, current distribution and prediction of future spread. Preslia 89: 1–16. https://doi.org/10.23855/preslia.2017.001
  • Sölter U, Verschwele A, Starfinger U (2016) Viability of seeds ripened after cutting (pot experiment). In: Sölter U, Starfinger U, Verschwele A (Eds) HALT Ambrosia – final project report and general publication of project findings (Julius-Kühn-Archiv 455). Quedlinburg, 36. https://doi.org/10.5073/jka.2016.455.12
  • Sun Y, Broennimann O, Roderick G, Poltavsky A, Lommen STE, Mueller-Schaerer H (2017) Climatic suitability ranking of biological control candidates: a biogeographic approach for ragweed management in Europe. Ecosphere.
  • Tokarska-Guzik B, Bzdęga K, Koszela K, Żabińska I, Krzuś B, Sajan M, Sendek A (2011) Allergenic invasive plant Ambrosia artemisiifolia L. in Poland: threat and selected aspects of biology. Biodiversity: Research and Conservation, 39 pp. https://doi.org/10.2478/v10119-011-0008-8
  • Toole E, Brown E (1946) Final results of the Durvel buried seed experiment. Journal of Agricultural Research 72: 201–210.
  • Vitalos M, Karrer G (2009) Dispersal of Ambrosia artemisiifolia seeds along roads: the contribution of traffic and mowing machines. In: Pyšek P, Pergl J (Eds) Biological Invasions: Towards a Synthesis, Proceedings of the 5th Neobiota Conference, September 2008.Inst. of Ecology of the TU Berlin, Prague, Czech Republic, 53–60.
  • Williams JL, Miller TEX, Ellner SP (2012) Avoiding unintentional eviction from integral projection models. Ecology 93: 2008–2014. https://doi.org/10.1890/11-2147.1
  • Zalai M, Poczok L, Dorner Z, Körösi K, Pálinkás Z, Szalai M, O. P (2017) Developing control strategies against common milkweed (Asclepias syriaca L.) on ruderal habitats. Herbologia 16: 69–84. https://doi.org/10.5644/Herb.16.2.07
  • Zhang R, Shea K (2012) Integrating multiple disturbance aspects: management of an invasive thistle, Carduus nutans. Annals of Botany 110: 1395–1401. https://doi.org/10.1093/aob/mcr312

Supplementary materials

Supplementary material 1 

Analysis of mowing experiment data (statistical analysis of empirical data)

Suzanne T. E. Lommen, Eelke Jongejans, Melinda Leitsch-Vitalos, Barbara Tokarska-Guzik, Mihály Zalai, Heinz Müller-Schärer, Gerhard Karrer
This dataset is made available under the Open Database License (http://opendatacommons.org/licenses/odbl/1.0/). The Open Database License (ODbL) is a license agreement intended to allow users to freely share, modify, and use this Dataset while maintaining this same freedom for others, provided that the original source and author(s) are credited.
Download file (461.49 kb)
Supplementary material 2 

Demographic survey of reference populations (location table, methods)

Suzanne T. E. Lommen, Eelke Jongejans, Melinda Leitsch-Vitalos, Barbara Tokarska-Guzik, Mihály Zalai, Heinz Müller-Schärer, Gerhard Karrer
This dataset is made available under the Open Database License (http://opendatacommons.org/licenses/odbl/1.0/). The Open Database License (ODbL) is a license agreement intended to allow users to freely share, modify, and use this Dataset while maintaining this same freedom for others, provided that the original source and author(s) are credited.
Download file (582.12 kb)
Supplementary material 3 

Burial experiments (location table, methods, graphic results)

Suzanne T. E. Lommen, Eelke Jongejans, Melinda Leitsch-Vitalos, Barbara Tokarska-Guzik, Mihály Zalai, Heinz Müller-Schärer, Gerhard Karrer
This dataset is made available under the Open Database License (http://opendatacommons.org/licenses/odbl/1.0/). The Open Database License (ODbL) is a license agreement intended to allow users to freely share, modify, and use this Dataset while maintaining this same freedom for others, provided that the original source and author(s) are credited.
Download file (457.95 kb)
Supplementary material 4 

Parametrisation of population models of unmanaged references (model parameterisation)

Suzanne T. E. Lommen, Eelke Jongejans, Melinda Leitsch-Vitalos, Barbara Tokarska-Guzik, Mihály Zalai, Heinz Müller-Schärer, Gerhard Karrer
This dataset is made available under the Open Database License (http://opendatacommons.org/licenses/odbl/1.0/). The Open Database License (ODbL) is a license agreement intended to allow users to freely share, modify, and use this Dataset while maintaining this same freedom for others, provided that the original source and author(s) are credited.
Download file (623.98 kb)
Supplementary material 5 

Parametrisation of population models of experimental mowing treatments (model parameterisation)

Suzanne T. E. Lommen, Eelke Jongejans, Melinda Leitsch-Vitalos, Barbara Tokarska-Guzik, Mihály Zalai, Heinz Müller-Schärer, Gerhard Karrer
This dataset is made available under the Open Database License (http://opendatacommons.org/licenses/odbl/1.0/). The Open Database License (ODbL) is a license agreement intended to allow users to freely share, modify, and use this Dataset while maintaining this same freedom for others, provided that the original source and author(s) are credited.
Download file (542.42 kb)
Supplementary material 6 

Stochastic population growth for alternative seed bank scenarios (graphic results, population dynamics)

Suzanne T. E. Lommen, Eelke Jongejans, Melinda Leitsch-Vitalos, Barbara Tokarska-Guzik, Mihály Zalai, Heinz Müller-Schärer, Gerhard Karrer
This dataset is made available under the Open Database License (http://opendatacommons.org/licenses/odbl/1.0/). The Open Database License (ODbL) is a license agreement intended to allow users to freely share, modify, and use this Dataset while maintaining this same freedom for others, provided that the original source and author(s) are credited.
Download file (417.98 kb)
Supplementary material 7 

Deterministic population models per reference data set (graphic results, population dynamics)

Suzanne T. E. Lommen, Eelke Jongejans, Melinda Leitsch-Vitalos, Barbara Tokarska-Guzik, Mihály Zalai, Heinz Müller-Schärer, Gerhard Karrer
This dataset is made available under the Open Database License (http://opendatacommons.org/licenses/odbl/1.0/). The Open Database License (ODbL) is a license agreement intended to allow users to freely share, modify, and use this Dataset while maintaining this same freedom for others, provided that the original source and author(s) are credited.
Download file (691.93 kb)
Supplementary material 8 

r-cost curves for different seed survival scenarios and reference data sets (graphic results, population dynamics)

Suzanne T. E. Lommen, Eelke Jongejans, Melinda Leitsch-Vitalos, Barbara Tokarska-Guzik, Mihály Zalai, Heinz Müller-Schärer, Gerhard Karrer
This dataset is made available under the Open Database License (http://opendatacommons.org/licenses/odbl/1.0/). The Open Database License (ODbL) is a license agreement intended to allow users to freely share, modify, and use this Dataset while maintaining this same freedom for others, provided that the original source and author(s) are credited.
Download file (446.71 kb)
login to comment